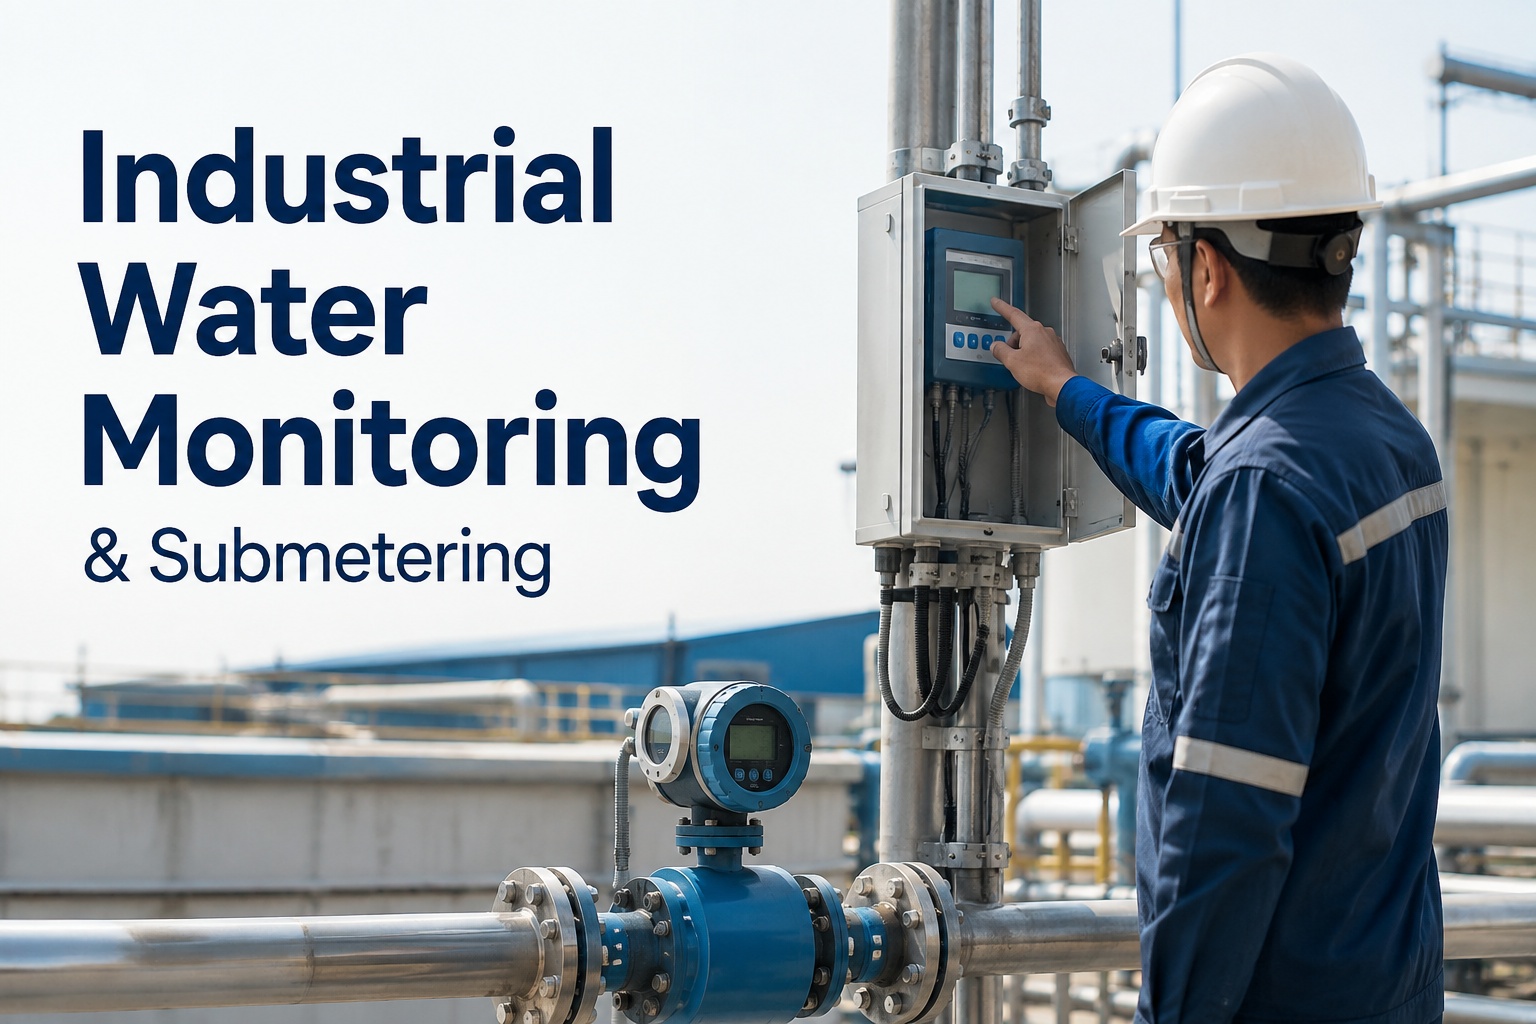
Industrial Water Monitoring & Submetering | Oxmaint
By Riley Quinn on August 21, 2026
Most UK industrial sites can tell you how much water they used last quarter. Very few can tell you where it went. The quarterly meter reading from your licence provider is a bill, not a diagnostic. Meanwhile, a burst service, a stuck cooling-tower float, or a leaking washdown lance can leak thousands of litres a day for weeks before it hits an invoice. Oxmaint gives industrial teams live submetering, line-level attribution, abnormal-consumption alerts and leak triggers — turning water from unmanaged cost into a controllable metric. Book a demo to see water monitoring in action.
£1,000s
typical monthly cost of an undetected underground burst on an industrial site between meter reads
15 min
AMR data logger reading interval — 96x per day vs 1-4 readings from a manual meter each year
40%
projected demand-supply freshwater gap globally by 2030 — UN and WRI figures driving corporate water reporting
Where Industrial Water Actually Goes
A typical UK industrial site's water goes to five broad categories — process water, cooling systems, washdown, sanitary, and utility. But most sites can only report the total number. Without submetering, cost allocation becomes a spreadsheet estimate, efficiency projects have no baseline to measure against, and a leak in one category hides behind normal consumption in another. Submetering — placing individual meters on each major consumer — is the foundational step every water-efficiency programme rests on.
Typical Water Attribution · Industrial Site
Illustrative — actual mix varies substantially by sector (food & beverage, textiles and metals typically use more)
Process water
~40%
Cooling systems
~28%
Washdown & CIP
~15%
Sanitary / welfare
~9%
Boiler feed & utility
~8%
Attribution below the site total is only possible with submeters or in-line AMR loggers on each consumer.
The Six Hidden Sources of Industrial Water Waste
Every water audit surfaces the same recurring waste categories. None of them are exotic — they're the things everyone knows to check but nobody sees because nobody is measuring. Submetering plus abnormal-consumption alerts is what forces these to the surface, because a stuck float valve running overnight looks the same to a spreadsheet as normal daytime demand, but looks completely different to a 15-minute AMR log.
Underground bursts
Between annual meter reads, an underground service leak can flow undetected for months. AMR logger night-flow analysis catches it in hours.
Stuck float valves
Cooling tower and storage tank floats that fail open — water runs to drain 24/7 until someone notices. Night-flow > 0 is the giveaway.
Leaking washdown lances
Hoses left running, worn seals, damaged spray guns. Post-shift consumption on production lines flags them straight away.
Failed CIP cycles
Clean-in-place systems running double or triple cycles due to sensor drift or programme error. Per-batch water use makes the anomaly visible.
Over-cycling cooling towers
Poor blowdown control means excessive make-up water. Trending make-up rate against ambient temperature exposes the inefficiency.
Once-through cooling
Legacy equipment quietly using mains water for cooling and dumping to drain. Line-level submeters make the volume — and cost — undeniable.
Normal vs Abnormal — The Pattern That Catches Leaks
The single most useful analytic in industrial water monitoring is the night-flow chart. A well-run site drops to near-zero consumption between shifts — sanitary usage plus base cooling load. Anything else is either an oversight (equipment left running) or a leak. Oxmaint plots consumption on a rolling profile and alerts when the current 24-hour trace departs from the historical baseline by more than a configurable threshold.
24-Hour Water Consumption · Normal vs Leak Signature
Baseline profile · previous 30 days average
Current 24 hours · abnormal signature detected
See Live Water Monitoring & Anomaly Alerts
Walk through the submetering setup, the 15-minute AMR data feed, the abnormal-consumption alert rules and the maintenance work-order integration — configured against real UK site data. Thirty minutes with the Oxmaint team.
A monitoring dashboard that only produces charts is a data project, not an operational tool. The value of water monitoring emerges when an anomaly automatically raises a maintenance work order — assigned to the right technician, tied to the specific line or asset, with the trend evidence attached. Oxmaint's water module is a first-class part of the CMMS: leak alerts become priority WOs, cooling-tower efficiency drift becomes scheduled inspection, per-batch CIP anomalies become recipe reviews. Data becomes action inside the same platform the maintenance team already works in. Sign up free to connect water alerts to your work order flow.
Expert Perspective — Why Water Never Gets the Attention Energy Does
Industrial water costs 5-15x less per kWh-equivalent than electricity, so it tends to be an afterthought in utility-efficiency programmes even when the volumes and waste percentages are enormous. But the shift is happening — water scarcity is now a directors' report topic in most UK annual reports, ESG frameworks measure it explicitly, and a burst service costing thousands of pounds a month between meter reads is impossible to defend once you can see it in the data. The sites getting ahead treat water with the same submetering discipline they already apply to electricity — because the same principle applies: you cannot manage what you don't measure.
Night-flow analysis first
Overnight consumption drops to near-zero on a well-run site. Anything else is leak or oversight. It's the single highest-value chart to build.
Per-batch and per-tonne metrics
Absolute consumption hides efficiency change under production volume swings. Litres-per-batch or litres-per-tonne exposes real efficiency trends.
Integration with maintenance
Every anomaly becomes a work order or it becomes nothing. Alerts that don't trigger action in the maintenance system get filtered out and forgotten.
Baseline before intervention
Efficiency projects need pre-project baseline to measure impact. Install submeters first, baseline for 30 days, then act — not the other way round.
Who Uses Oxmaint for Industrial Water Monitoring
The platform is used by the specific UK operational roles that carry water performance accountability: sustainability managers reporting to ESG frameworks and board-level water metrics, facilities and utilities managers running submetering programmes across manufacturing sites, maintenance managers whose teams close out the leak work orders anomaly alerts generate, energy managers combining water alongside electricity and gas under one utility view, operations directors driving cost-per-tonne and cost-per-batch efficiency across production lines, and EHS teams keeping trade effluent consent and Mogden formula charge exposure under control. Each role sees the same underlying data filtered to their view — consumption dashboard, anomaly queue, per-line efficiency trend or ESG report export. Sign up free to configure roles for your utility team.
Getting Water Monitoring Live
Deployment starts with a site walk to identify where submeters should go — mains inlet, each cooling tower loop, each production line, boiler feed, welfare block. AMR data loggers on existing meters give 15-minute reads without changing the meter. Sensor data flows into Oxmaint through standard Modbus, MQTT or REST integration. Baseline profiles build over the first 30 days, anomaly thresholds are tuned, and alerts start firing as prioritised work orders. Most single-site deployments move from initial scoping to live anomaly monitoring inside 45-60 days. Book a walkthrough to see live UK water deployments.
Turn Water From Overhead Cost to Controllable Metric
Oxmaint gives industrial sites live water submetering, line-level attribution, anomaly detection and leak-alert integration into the maintenance workflow — the visibility water needs to stop being the utility nobody manages.
What is industrial water monitoring and why does it matter?
Industrial water monitoring is the continuous measurement of water consumption across the different uses on an industrial site — mains inlet, cooling systems, process water, washdown, welfare and utilities. It matters because a single quarterly meter reading from a licence provider is a bill, not a diagnostic. Between reads, an underground burst, stuck float valve or failing CIP cycle can quietly consume thousands of litres and pounds. Continuous monitoring closes that visibility gap and turns water from an unmanaged overhead into a controllable operational metric.
How does submetering actually work on an existing site?
Submeters install on each major consumer — cooling tower make-up, boiler feed, each production line, welfare block, process water — either as new in-line meters during a planned shutdown or as AMR (Automatic Meter Reading) data loggers retrofitted to existing meters. Loggers capture readings at 15-minute intervals, transmit via GSM or MQTT to the Oxmaint platform, and produce continuous consumption traces per meter. The retrofit approach avoids process disruption and typically completes at each meter in under an hour.
Can water usage be tracked per production line or asset?
Yes — that's the specific value of submetering. Each meter is linked to the asset, cost centre or production line it serves. Consumption reports and efficiency metrics (litres-per-tonne, litres-per-batch, litres-per-hour) are calculated automatically. This asset-level attribution is what enables cost allocation between departments, comparison between production lines running the same product, and evidence-based investment cases for line-specific water reduction projects.
How does the platform detect leaks?
Three complementary methods. First, night-flow analysis: consumption between shifts should drop to near-zero — anything above the baseline threshold triggers an alert. Second, per-hour rate-of-change: consumption climbing beyond normal operating range flags a developing leak. Third, cumulative anomaly detection: unusual daily totals for the meter's historical profile raise a review. All three feed straight into the CMMS as prioritised work orders, so alerts land as jobs the maintenance team actions, not as passive dashboard signals.
Does this support UK ESG and sustainability reporting?
Yes. Water consumption data — total, per-source, per-tonne, per-unit-produced — is available as scheduled or on-demand exports in formats aligned to common UK reporting frameworks including SECR (Streamlined Energy and Carbon Reporting), ISO 14001 environmental management, and TCFD/ESG voluntary disclosures. Consumption trends over time, reduction against baseline, and per-site comparisons support directors' report water sections and Mogden-formula trade effluent charge modelling. Reporting is a byproduct of daily operational monitoring, not a separate exercise at year-end.