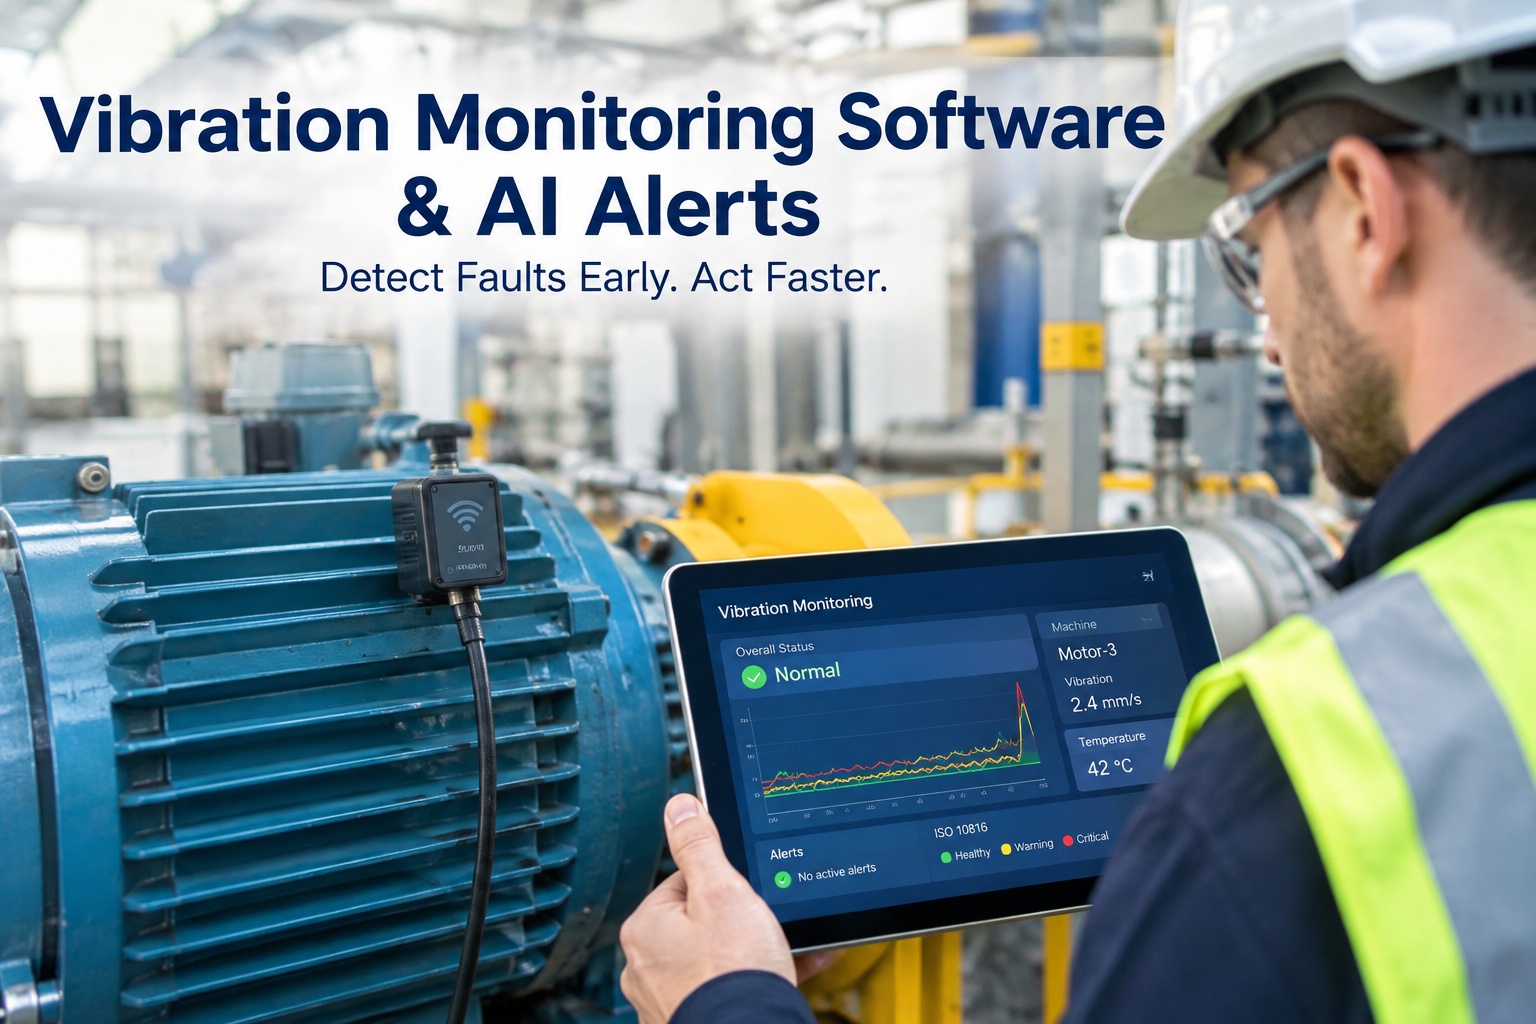
A rotating asset developing a bearing defect starts vibrating differently long before it fails audibly. The problem isn't detection technology — vibration sensors have been available for decades. It's that periodic route-based measurements catch faults every 30 days if you're lucky, while a bearing can progress from early defect to seizure in less. Oxmaint ingests vibration data continuously, applies ISO 10816 / 20816-aligned severity thresholds per machine class, and raises a work order the moment a reading crosses into an alarm zone. Book a reliability demo to see continuous vibration monitoring.
4.5
mm/s RMS — the Zone C/D boundary for Class I machines, industry-standard shutdown threshold
10-1000
Hz measurement band for broadband vibration velocity per ISO 10816-3
120-15k
RPM operating range covered — from slow gear drives to high-speed turbomachinery
Why the ISO Standard Matters
Vibration data without a reference framework is just numbers. The single most useful contribution ISO 10816 (now published as ISO 20816) makes to reliability engineering is a clear, internationally agreed answer to "how much vibration is too much?" — expressed as broadband RMS velocity in mm/s, measured on the non-rotating bearing housings, evaluated against four severity zones for four machine groups. Oxmaint applies the exact ISO matrix to every sensor reading, so an alert isn't a subjective interpretation of trend — it's a defined zone transition.
ISO 10816 / 20816 Severity Matrix — RMS Velocity (mm/s)
Values are Annex B guideline limits — actual thresholds may be tightened per OEM specification or asset criticality
Zone A — newly commissioned or overhauled condition
Zone B — acceptable for unrestricted long-term operation
Zone C — remedial action must be scheduled
Zone D — immediate shutdown to prevent damage
Because the class matters as much as the number, a 4.5 mm/s reading is an emergency on a Class I motor and normal operating vibration on a Class IV pump. Sign up free to configure ISO 10816 classes against your specific asset fleet.
Reading the Frequency Spectrum — What the Waveform Actually Tells You
Broadband RMS velocity gives you the go/no-go zone decision. But once a reading crosses into Zone C, the reliability engineer's next question is why — and that answer sits in the frequency spectrum. Different failure modes produce vibration at different frequencies relative to running speed. Imbalance shows at 1× RPM. Misalignment shows strongly at 2×. Bearing defects produce specific bearing frequencies (BPFO, BPFI, BSF). Oxmaint's FFT view exposes the whole spectrum so the failure mode identifies itself.
FFT Spectrum · PUMP-08 · Horizontal bearing
Zone C · 5.2 mm/s RMS
5.04.03.02.01.00
0.5×1×1.5×2×2.5×3×4×5×BPFO10×12×15×
1
Peak at 1× RPM — dominant unbalance signature. Suggests mass imbalance on the impeller.
2
Elevated 2× RPM — misalignment component present, likely coupling.
3
Peak at BPFO frequency — outer race bearing defect emerging. Early stage.
The Fault-Mode Fingerprint Chart
The reason vibration monitoring outperforms almost every other condition-monitoring technique on rotating equipment is that different faults leave different fingerprints in the frequency spectrum. Once the AI classifies the pattern, the work order that gets raised isn't just "asset is vibrating" — it's "asset shows Class I misalignment signature at coupling, priority 2, expected labour 3 hours". The engineer arrives already knowing what to look for.
1× RPM
Unbalance
Dominant peak at running speed, primarily radial direction. Increases with RPM² — very load-dependent.
1× & 2× RPM
Misalignment
Strong 1× and 2× peaks, often high axial vibration. Coupling wear, foundation shift, thermal growth.
1× RPM harmonics
Mechanical looseness
Multiple harmonics of running speed (2×, 3×, 4×). Loose bolts, worn mounts, cracked frames.
BPFO / BPFI / BSF
Bearing defect
Specific bearing frequencies — outer race, inner race, ball spin. Progresses through 4 defect stages.
Gear mesh × N
Gear tooth wear
Gear mesh frequency with sidebands. Sideband spacing points to which gear carries the defect.
2× line freq
Electrical fault
100 Hz (UK 50 Hz mains) peaks. Rotor bar issues, stator problems, air-gap eccentricity on motors.
See Vibration Turn Into Diagnosis on Your Assets
Watch Oxmaint ingest a live vibration reading, classify the fault mode from the frequency spectrum, and raise a targeted work order with the diagnosis attached. Thirty minutes on your own sensor types.
Continuous vs Route-Based Monitoring
The old model of route-based vibration collection — an analyst walking a route once a month, taking readings at set points, downloading them into analysis software — still exists at many sites. It works, but the 30-day gap between readings is exactly the window in which many bearing defects escalate from Stage 2 to Stage 4. Continuous monitoring closes that window entirely. Fixed sensors read at high frequency, the AI trends every reading, and the alert fires at zone transition rather than at the next scheduled walkaround.
Route-Based Collection
Reading frequencyMonthly, sometimes quarterly
Detection lagUp to 30-90 days
Analyst dependencyCertified vibration analyst
Trend visibilityPoint-in-time snapshots
Data → work orderManual translation
Continuous AI Monitoring
Reading frequencyContinuous, every asset with sensor
Detection lagMinutes to hours
Analyst dependencyAI classifies, engineer verifies
Trend visibilityRolling live trend per asset
Data → work orderAutomatic on zone transition
Expert Perspective — Class, Baseline, Fusion
The three things reliability teams consistently get wrong on vibration monitoring aren't measurement problems — they're interpretation problems. Applying the wrong ISO class to an asset (using Class II thresholds on a Class IV machine), using generic thresholds instead of per-asset baselines, and treating vibration as a standalone signal rather than fusing it with thermal, oil and load-current data. Each of those alone will produce false confidence or false alarms.
Correct class assignment
Class I vs Class IV changes the Zone D threshold from 4.5 mm/s to 18 mm/s — the same reading tells opposite stories.
Baselines beat generics
A pump that always runs at 3.2 mm/s doesn't need alerting at 3.5. Learn the asset's normal envelope, then flag deviation from that.
Fuse the signals
Vibration + thermal + oil analysis catches faults that any single technique misses. AI correlation across streams is where diagnostic accuracy jumps.
Bearing stages matter
Bearing defects progress through 4 stages. Stage 2 gives you weeks of warning; Stage 4 gives you hours. Catch them early.
Who Uses Continuous Vibration Monitoring
The workflow is used by the specific roles that own rotating-asset reliability: reliability engineers managing pumps, motors, fans and gearboxes on production-critical lines, maintenance managers replacing route-based collection with continuous coverage on their bad-actor assets, condition monitoring specialists integrating vibration into a multi-technique programme with thermal and oil analysis, and operations directors measuring whether reliability investment is producing measurable reduction in unplanned rotating-plant failures. Each role sees the same underlying vibration data filtered to their view — fleet dashboard, asset FFT, or MTBF trend. Sign up free to connect sensors to your existing asset register, or book a walkthrough to see spectrum analysis on your fleet.
Getting Vibration Monitoring Live in 30 Days
Deployment doesn't require rebuilding your sensor infrastructure. Existing wired or wireless accelerometers connect via standard protocols, sites without sensors can start with wireless installs on their most critical assets, and the AI baseline learning begins immediately. Within the first week ISO 10816 classes are assigned per asset, thresholds apply automatically, and every zone transition triggers a diagnosed work order with FFT evidence attached. Sign up free to configure vibration monitoring for your critical rotating plant in the first setup session.
Turn Continuous Vibration Data Into Diagnosed Work Orders
Move from monthly route data to 24/7 monitoring. Oxmaint applies ISO 10816 / 20816 thresholds, classifies fault-mode signatures in the FFT, and raises targeted work orders with the diagnosis and evidence attached.
Frequently Asked Questions
Which vibration sensors does Oxmaint support?
Oxmaint integrates with wired accelerometers, wireless vibration sensors from major manufacturers (SKF, IFM, Emerson, Bently Nevada, Hansford Sensors and other ISO 10816-compliant devices), and can also ingest data from existing PLC/SCADA vibration channels. Sites with legacy sensor infrastructure typically connect via existing data historians; new deployments usually go wireless for lower installation cost. The AI analytics run against the same schema regardless of sensor source.
Is ISO 10816 still the current standard or has it been replaced?
ISO 10816 has been superseded by ISO 20816 as the current designation, but the two share the same evaluation zones (A/B/C/D) and the same numerical velocity limits. A reading evaluated against either standard produces the same result. Both are still widely referenced in field practice and in older documentation. Oxmaint labels alerts against both names to avoid confusion, particularly for sites transitioning between older and newer engineering documents.
Do we still need a certified vibration analyst?
For most day-to-day operations, no — the AI handles zone classification and fault-mode identification, and the engineering team acts on the resulting work order. For complex investigations, unusual failure patterns, or high-consequence assets (critical process turbomachinery, safety-classified equipment), a certified analyst still adds real diagnostic value, and Oxmaint gives them full spectrum data, waveforms and history to work from. The AI removes the routine analyst workload; it doesn't remove the need for analyst expertise entirely.
Can vibration monitoring detect early-stage bearing faults?
Yes — this is where vibration monitoring genuinely outperforms other techniques. Bearings progress through four defect stages, each with a distinct vibration signature. Stage 1 shows subsurface fatigue detectable only in the ultrasonic range (25-50 kHz). Stage 2 produces bearing defect frequencies (BPFO, BPFI, BSF) in the mid-frequency spectrum. Stage 3 sees harmonics and sidebands appear. Stage 4 is broadband noise and imminent failure. Oxmaint catches the transition into Stage 2, giving weeks of scheduled-maintenance warning instead of hours of firefighting.
How does this fit with thermal and oil analysis?
The three techniques are complementary and their combined diagnostic accuracy is much greater than any one alone. Vibration catches mechanical faults; thermal catches electrical connection issues and load conditions; oil analysis catches wear debris and contamination invisible to both. Oxmaint holds all three data streams against the same asset record — when vibration and thermal both flag an anomaly, the confidence score on the resulting work order is far higher than either signal on its own.