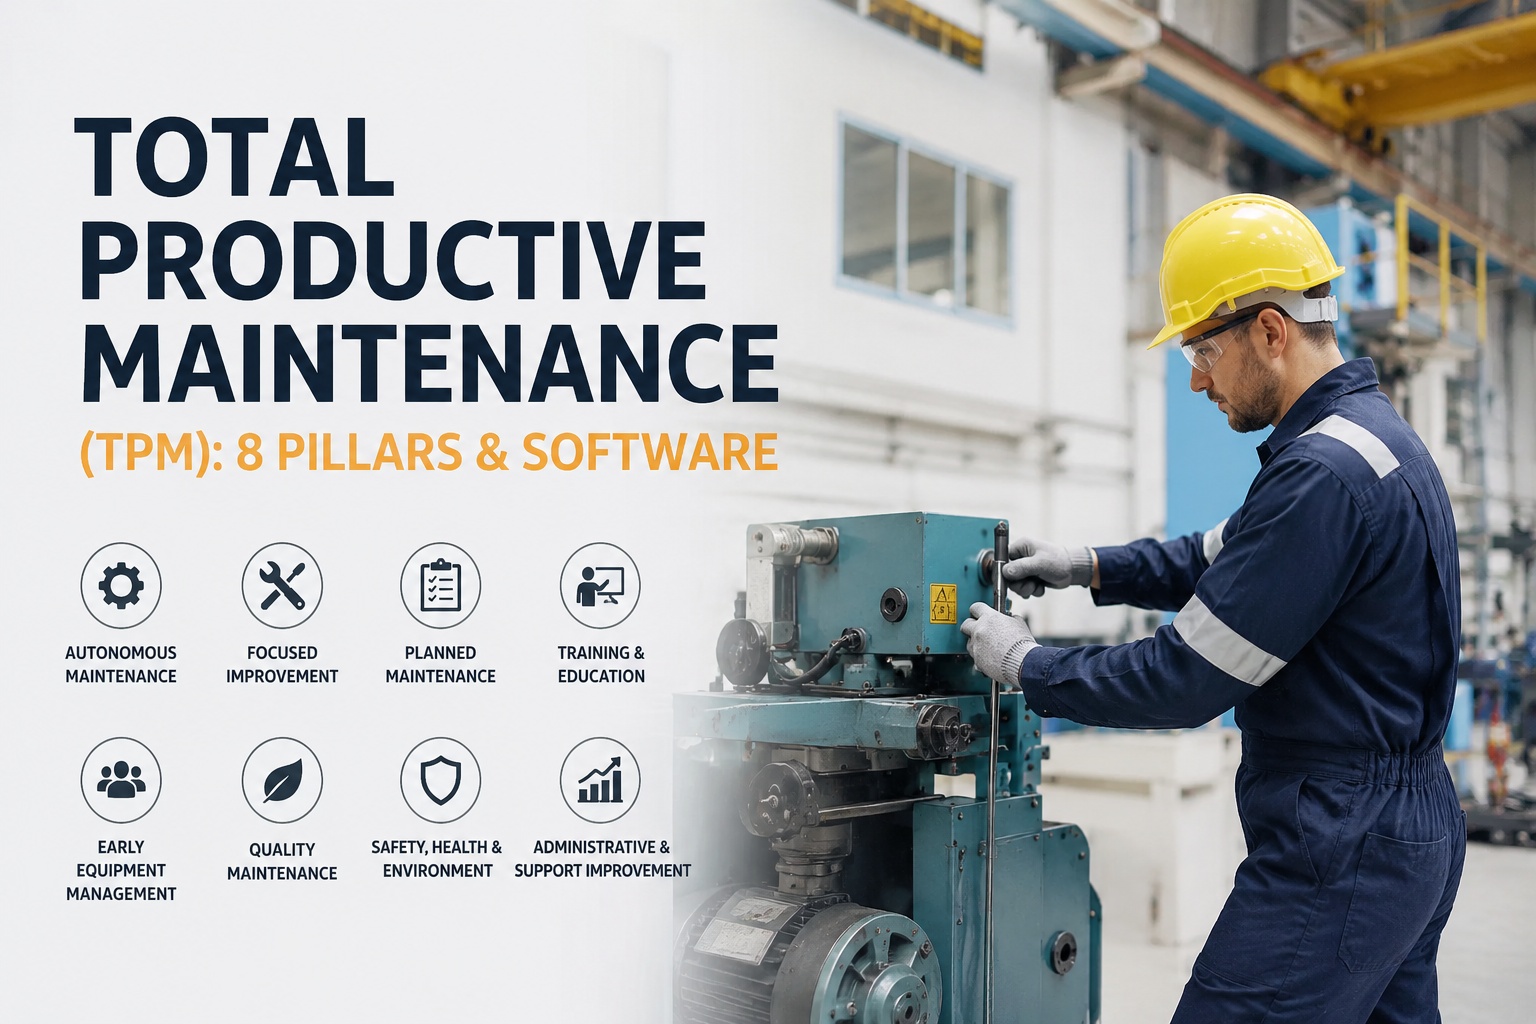
If your maintenance team is stuck in firefighting mode — reacting to breakdowns, chasing missed PMs, wondering why OEE never gets past 65 percent — you are not alone, and the answer is not more technicians. It is Total Productive Maintenance (TPM), the Japanese methodology that produced the OEE metric itself and taken plants from 60 to 85 percent world-class OEE. This guide walks through the 8 pillars, the metrics, and how CMMS software makes digital TPM practical for UK operations. Sign up free to Oxmaint and see the TPM workspace live.
The TPM House
One Framework. 5S Foundation. 8 Pillars. One Roof: World-Class OEE.
Nakajima 1988 · JIPM Distinguished Plant Prize criteria · the canonical structure of TPM
Zero breakdowns · Zero defects · Zero accidents · 85%+ OEE
01
Autonomous Maintenance
Jishu Hozen
02
Planned Maintenance
Keikaku Hozen
03
Focused Improvement
Kobetsu Kaizen
04
Quality Maintenance
Hinshitsu Hozen
05
Early Equipment Mgmt
Shoki Kanri
06
Education & Training
Kyōiku Kunren
07
Safety, Health, Environ.
SHE
08
TPM in Administration
Kanri Kansetsu
Foundation · 5S
Sort · Seiri
Set in order · Seiton
Shine · Seiso
Standardise · Seiketsu
Sustain · Shitsuke
What Is Total Productive Maintenance, Really?
Total Productive Maintenance is not a tactic — it is a company-wide strategy. Developed at Nippondenso (a Toyota supplier) in the 1960s and codified by Seiichi Nakajima in 1988, TPM shifts the entire organisation from reactive firefighting to proactive equipment stewardship. It is what generated the OEE metric in the first place. The world-class 85% OEE benchmark comes from Japanese plants that won JIPM's Distinguished Plant Prize through TPM implementation. When someone asks "what OEE should we be aiming for?" — the answer traces back to TPM.
The core insight is simple and slightly uncomfortable: the person closest to the machine catches problems first — but only if you give them the training, ownership, and time to look. TPM restructures who owns equipment health. Traditionally operators run the machine and technicians fix it. That split creates a gap where loose bolts, small leaks, and micro-contamination go unnoticed until they become breakdowns. TPM closes the gap by making operators the first line of defence. Want to see what this actually looks like inside a live UK plant? Book a 30-minute demo and watch a real TPM workspace in action.
Traditional
Operators run · Technicians fix
Operator spots issue · waits for technician
Small leaks and loose bolts unnoticed
Maintenance is reactive · always firefighting
Skills split · knowledge fragmented
Result · OEE plateau around 60% · breakdown-driven culture
→
TPM Way
Everyone owns equipment health
Operator catches deterioration daily · CIL routine
Early warnings raised as work orders
Technicians free for skilled reliability work
Skills accumulate · culture of ownership
Result · OEE climbs toward 85% world-class · zero-breakdown direction
The 8 Pillars of TPM — What Each One Actually Does
Each pillar targets a specific loss type. Together they eliminate the eight big losses that suppress OEE across virtually every manufacturing operation. Here is what each pillar tackles in practical terms. Curious how these 8 pillars actually map onto a working digital platform? Book a free demo and we will walk you through each pillar in Oxmaint.
01
Autonomous Maintenance
Jishu Hozen
Operators own the daily care of their equipment — cleaning, inspection, lubrication, minor adjustment. The CIL routine (Clean · Inspect · Lubricate) becomes a shift discipline, not an interruption.
Frees technicians for skilled work · catches early-stage deterioration
02
Planned Maintenance
Keikaku Hozen
Scheduled preventive maintenance based on failure data, manufacturer intervals, and equipment history — done during planned downtime rather than in reaction to breakdowns.
Predictable equipment availability · lower emergency spend
03
Focused Improvement
Kobetsu Kaizen
Cross-functional teams tackle specific losses with structured problem-solving (5 Whys, fishbone, PDCA). Root causes eliminated one by one, not patched.
Sustained loss elimination · rising OEE curve
04
Quality Maintenance
Hinshitsu Hozen
Equipment condition connected directly to product quality. Design out defects at the machine rather than catch them at inspection.
Lower rework and scrap · zero-defect direction of travel
05
Early Equipment Management
Shoki Kanri
Maintenance insight fed back into equipment design and procurement. New machines specified for maintainability from day one, not diagnosed after purchase.
Faster time to stable operation on new lines
06
Education & Training
Kyōiku Kunren
Skill matrices per role, structured competency development, cross-training. Operators graduate through inspection skills; technicians develop diagnostic depth.
Skills as a plant asset · reduced key-person risk
07
Safety, Health, Environment
SHE
Zero accidents as a design goal. Fewer breakdowns mean fewer high-risk emergency interventions. Environmental impact tracked alongside operational metrics.
Lower accident rate · HSE compliance strengthened
08
TPM in Administration
Kanri Kansetsu
TPM principles extended to office functions — procurement, planning, HR, finance. Reduces indirect losses that suppress plant performance.
Support functions aligned with operational reality
Autonomous Maintenance in Practice: The Daily Rhythm
Autonomous Maintenance is the pillar most plants start with — because it is where the visible loss lives. The daily discipline is often summarised as CIL (Clean, Inspect, Lubricate) or the extended CLAIR (Clean, Lubricate, Adjust, Inspect, Repair). The routine is deceptively powerful: cleaning IS inspection. When an operator wipes down a machine, they touch every surface and spot leaks, cracks, loose fasteners, and abnormal wear. Want to see how digital CIL routines catch issues before they become breakdowns? Book a demo of the mobile CIL workflow — 30 minutes, no commitment.
The CIL Daily Rhythm — What Operators Actually Do
C
Clean
Wipe every accessible surface at shift start · cleaning IS inspection · spot leaks, cracks, loose fasteners
I
Inspect
Check gauges, temperatures, vibration, noise against known-normal state · log anomalies as work orders
L
Lubricate
Right lube · right point · right amount · right schedule · prevents the majority of mechanical failures
TPM and OEE: Two Halves of the Same Framework
You cannot talk about TPM without talking about Overall Equipment Effectiveness. OEE was designed to measure TPM progress. The formula strips equipment performance down to three multiplied percentages, each attacking a different loss category. The world-class 85 percent benchmark comes directly from JIPM award-winning plants running full TPM. Want to see your current OEE broken into Availability × Performance × Quality live per line? Book a demo of the OEE dashboard and see the exact loss picture on your equipment.
OEE = Availability × Performance × Quality
Each factor targets a different TPM pillar · all three matter equally
Availability
90%
Uptime after unplanned stops and changeovers
Planned + Autonomous Maintenance
×
Performance
95%
Speed loss and micro-stops during production
Focused Improvement
×
Quality
99.9%
Good parts as percentage of total parts
Quality Maintenance
=
The Real Benefits — Beyond the OEE Number
The TPM literature can make everything sound abstract. Here is what plants actually report after 12-24 months of committed implementation. These are pattern outcomes from documented deployments across UK and international manufacturing.
50–70%
Reduction in breakdowns
25–40%
Lower maintenance cost
50%+
Fewer safety incidents
30%+
Rework and scrap reduction
15–25%
Energy consumption cut
Beyond the numbers sit the harder-to-measure gains: operator ownership, cross-functional problem-solving culture, better morale, reduced key-person risk, and a maintenance team that finally has time for the reliability work they were trained for. These matter as much as the OEE improvement — and they are why TPM plants stay high-performing rather than sliding back after a couple of years. Want a realistic view of what these benefits look like at 6, 12 and 18 months? Book a demo and we will share the rollout results from comparable UK operations.
Ready to See TPM Actually Working on a Live Workspace?
Watch a 30-minute demo of Oxmaint configured for autonomous maintenance, planned maintenance, OEE tracking and focused improvement — the digital backbone of a real TPM programme.
Here is the hard truth nobody in TPM consulting likes to admit: most TPM programmes stall within 18 months — not because the principles are wrong, but because the paperwork suffocates the practice. Operators are handed CIL checklists on clipboards. Technicians get PM schedules in spreadsheets. OEE gets tracked in a whiteboard tally that gets erased at shift change. Focused improvement team findings live in one manager's notebook. Nothing connects. Nothing accumulates. The programme dies of administrative friction.
What Kills Most TPM Programmes — And What Digital TPM Fixes
Paper reality
CIL checklists on clipboards · get lost, get skipped, don't flag issues
→
Digital TPM
Mobile CIL routines · photo evidence · anomalies auto-raise work orders
Paper reality
Whiteboard OEE tallies erased at shift change · no trend visible
→
Digital TPM
Live OEE with A × P × Q breakdown · trended per line, shift and SKU
Paper reality
Focused improvement in a manager's notebook · findings die with the person
→
Digital TPM
Kaizen actions logged as tracked improvements · effect measured on OEE curve
Paper reality
Planned maintenance in a spreadsheet · attainment reported monthly, always late
→
Digital TPM
PM cadences per asset · attainment live · overdue flagged before it happens
The 90-Day Reality Check + KPIs That Prove TPM Works
Every TPM programme worth running eventually gets asked one question by finance: how do we know it is working? Two answers matter — the honest one about the first 90 days, and the metric set that surfaces the truth from month 4 onwards.
Every TPM programme I have watched succeed shares one uncomfortable truth: the first 90 days feel worse before they get better. Operators are being asked to do inspection and cleaning tasks they were not doing before. Managers see the CIL time as "lost production." Middle-shift technicians grumble because the operators keep raising work orders. Then somewhere around day 100, the picture flips — breakdowns halve, the technicians have their afternoons back, operators start bringing improvement ideas unprompted, and the OEE line stops dipping and starts climbing. The plants that quit before day 100 walk away thinking TPM does not work. It does — it just requires holding the line through the first quarter.
Beyond the 100-day inflection, these are the metrics a digital TPM platform should surface continuously — not monthly, not quarterly, but live on the shop floor and in every management review. Want to see these KPIs live before committing to anything? Book a demo and we will show you the KPI dashboard with sample UK plant data.
OEE
Overall Equipment Effectiveness · the master metric · target world-class 85%
MTBF
Mean Time Between Failures · rising line = TPM working
MTTR
Mean Time To Repair · falling line = maintenance skill improving
PM Compliance
Planned Maintenance completed on schedule · target above 90%
CIL Adherence
Autonomous Maintenance routines completed per shift
Breakdowns per 1000hrs
Unplanned failure rate · falling trend is the story
Safety Incidents
Recordables and near-misses · TPM plants trend toward zero
Kaizen Closures
Focused Improvement actions completed and verified for effect
Getting Started: A Practical UK TPM Rollout
You do not roll out TPM everywhere at once. Every documented success starts with a pilot line — typically the highest-value or highest-loss asset. Prove the model on one line, capture the OEE lift, build the internal case, then expand. This is the pattern from Nakajima's original work through modern UK plants running TPM today. Want to see a realistic rollout plan mapped to your specific operation? Book a demo and we will build a phased rollout view for your plant.
Months 1–3
Foundation + Pilot Line
5S deployed on the pilot line
Operators trained on CIL routines
Baseline OEE measured and displayed
Digital CMMS holds pilot data
Months 4–9
Autonomous + Planned Maintenance
Autonomous Maintenance mature on pilot
Planned Maintenance from failure data
First Focused Improvement projects
OEE lift documented for business case
Months 10–18
Plant-Wide Expansion
TPM extended line by line
Quality Maintenance layered in
Early Equipment Management for capex
Administrative TPM engaged
Frequently Asked Questions
Is TPM the same as preventive maintenance?
No. Preventive maintenance is one tactic (scheduled work orders). TPM is an organisation-wide strategy that includes preventive maintenance as one of its eight pillars. TPM also covers autonomous maintenance by operators, focused improvement projects, quality maintenance, early equipment management, training, safety and administrative practices. Preventive maintenance without the other pillars produces short-term uptime gains but no cultural change.
How long does TPM take to deliver results?
Pilot-line results typically appear in 3-6 months on the specific asset being worked. Plant-wide transformation takes 18-24 months to embed and 3-5 years to reach world-class OEE benchmarks. Nakajima's original benchmark from the JIPM Distinguished Plant Prize criteria required 3+ years of sustained implementation. The 90-day mark is the critical inflection point where breakdowns start falling and cultural change becomes visible.
Do we need CMMS software to run TPM?
You can start TPM on paper but you cannot sustain it. The administrative friction of tracking CIL routines, PM attainment, OEE per line and shift, focused improvement actions, and cross-pillar metrics collapses paper-based TPM within 12-18 months. Digital CMMS is what turns TPM from a training exercise into a durable operating system. It is also what makes the metrics visible enough to sustain executive support beyond the initial enthusiasm.
Does autonomous maintenance replace maintenance technicians?
No — it liberates them. Operators take on the routine cleaning, inspection, and lubrication tasks that used to consume technician time. Technicians then focus on skilled diagnostic work, reliability engineering, root cause analysis, and complex repairs. In documented TPM plants, technicians report higher job satisfaction and higher-value work after autonomous maintenance matures. Headcount typically stays the same but the work profile improves substantially.
Is TPM suitable for small UK manufacturing operations?
Yes. TPM scales down cleanly. A small plant can start with 5S on one production area, CIL routines on 2-3 critical machines, and OEE tracking on the pilot line. The full 8-pillar framework can be adopted progressively as the operation matures. Digital CMMS platforms designed for UK SME manufacturing (rather than enterprise heavy-industry) make the administrative overhead manageable at any scale. Many of the most disciplined TPM operations in the UK are family-run plants running 20-100 people.
Turn TPM From a Framework Into a Working System
Oxmaint digitises the 8 pillars — autonomous maintenance, planned maintenance, OEE, focused improvement, quality maintenance and more — in one connected platform designed for UK manufacturing. See it live in 30 minutes.