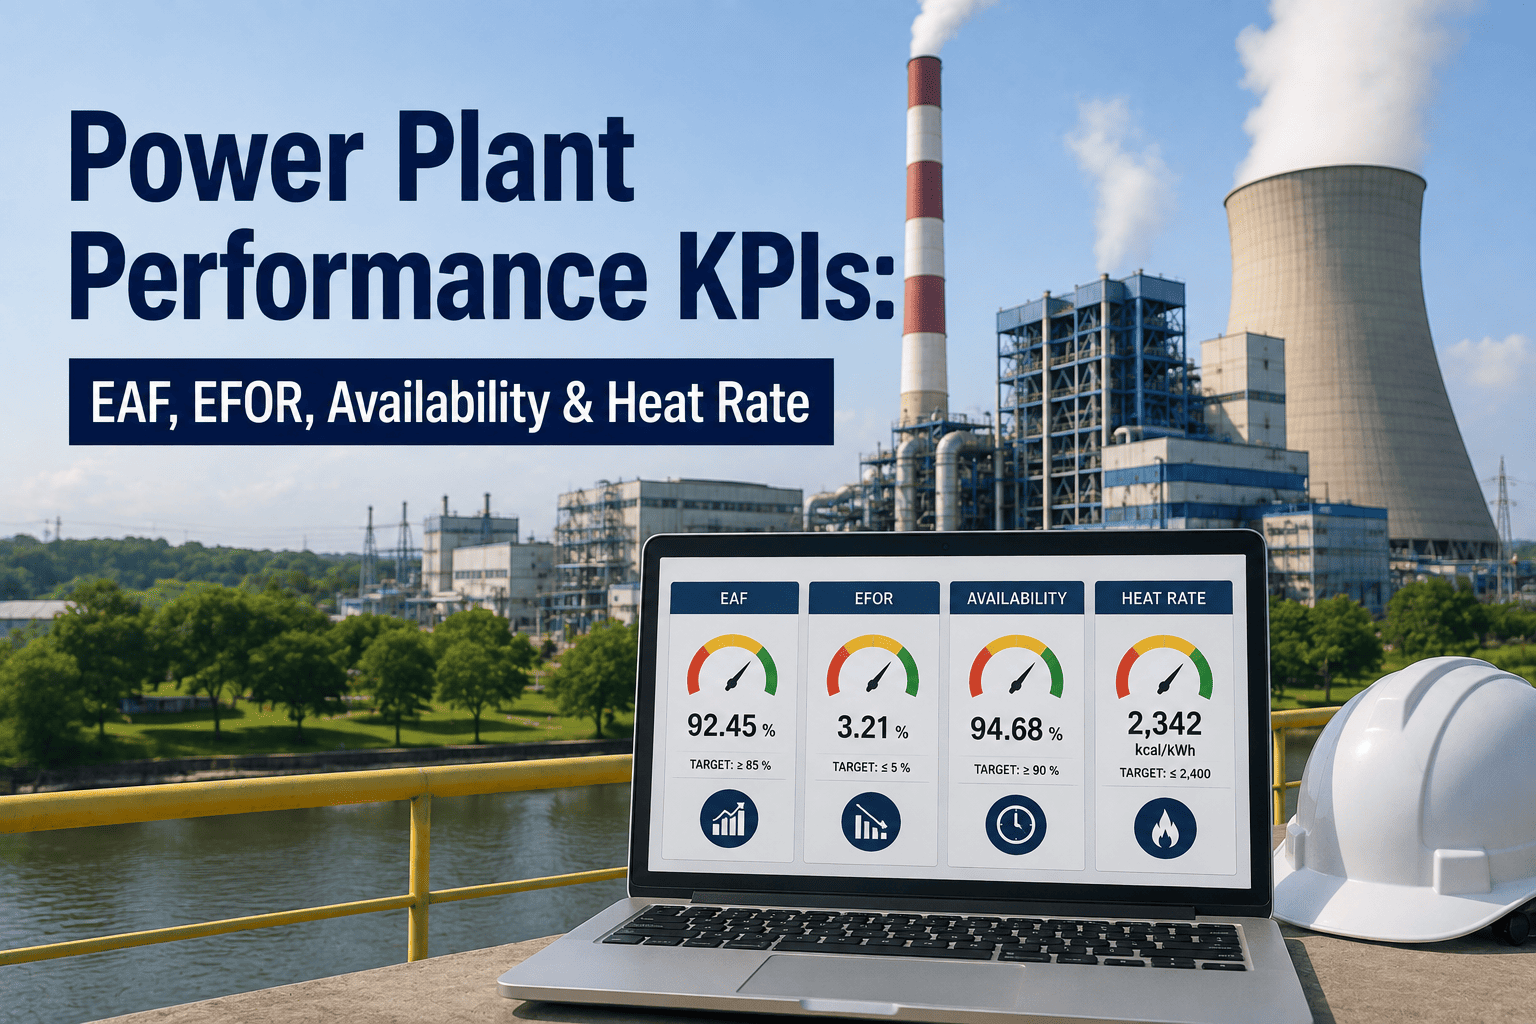
A unit can run every day of the year and still be losing money on efficiency nobody's watching. Availability tells you the plant showed up. Heat rate tells you what it cost to make that power. Most control rooms track the first number closely and the second one only at month-end, by which time the fuel has already been burned. Sign up to track EAF, EFOR, availability and heat rate against your unit's own baseline instead of finding out at the end of the quarter.
Why It Matters
A plant can post strong capacity factor numbers while quietly bleeding fuel cost through a heat rate that's drifted a few percent off design. Regulators and boards look at EAF and EFOR to judge reliability, but the P&L usually gets hit first by the KPI nobody's watching in real time.
The Core KPIs Every Plant Manager Tracks
| KPI |
What It Measures |
Why It Matters |
| EAF |
Share of period hours the unit was available at full or partial capacity |
The headline reliability number used for board and regulator reporting |
| EFOR |
Unplanned outage and derate hours as a share of demand hours |
Isolates failures the plant didn't choose, unlike planned maintenance |
| Availability Factor |
Time the unit was capable of running, regardless of dispatch |
Separates equipment readiness from market or dispatch decisions |
| Capacity Factor |
Actual energy produced against the maximum possible output |
Reflects both reliability and how the plant is being dispatched |
| Heat Rate |
Fuel energy burned per unit of electricity generated |
Drifts quietly with fouling, wear, and control loop tuning |
What Feeds Into Availability And Outage Numbers
Planned Outage Hours
Scheduled overhauls and inspections, counted against availability but not against EFOR
Forced Outage Hours
Unplanned trips and failures, the hours that drive EFOR up the fastest
Derated Hours
Unit is running but below full capacity, easy to lose track of between shifts
Reserve Shutdown Hours
Unit was available but not dispatched, counted for availability, not for EAF loss
Stop Reconciling KPIs In A Spreadsheet At Month End
Oxmaint pulls outage, derate, and fuel data into one dashboard so EAF, EFOR, availability and heat rate update as events happen, not after the report is due. Sign up for a free trial to see your unit's current numbers, or book a demo to walk through your fleet.
Building A KPI Dashboard Step By Step
Log Every Outage And Derate Against The Unit
Each event gets a start time, end time, and cause code, so EAF and EFOR can be recalculated automatically instead of tallied by hand
Feed In Fuel And Generation Readings Continuously
Heat rate only means something as a trend, so readings need to flow in shift by shift rather than arrive as a single month-end number
Set A Baseline And Flag Drift Early
Compare current heat rate and availability against the unit's own design or historical baseline, not a generic fleet average
4
Benchmark Across Units And Report Automatically
Rolling EAF, EFOR, capacity factor and heat rate feed straight into the dashboard, so reporting stops being a separate month-end task
How A Small Heat Rate Drift Turns Into A Big Fuel Bill
Small Drift
Fouling, wear, tuning
Goes Unflagged
No alarm, no trip
Fuel Cost Climbs
Same output, more fuel burned
Reliability Risk
Root cause may drive a forced outage
Unlike a trip or a leak, a heat rate drift doesn't announce itself. It shows up as a slightly higher fuel bill every shift, until the same underlying wear eventually shows up again as a forced outage and an EFOR hit.
The Payoff
Plants that track EAF, EFOR, and heat rate together, instead of in separate reports, tend to catch the connection between a reliability dip and a fuel cost spike much earlier. Catching that link early is usually what turns a routine repair into a real fuel saving, rather than an unplanned trip.
Frequently Asked Questions
Q
What counts as a good EAF for a power plant?
It depends heavily on unit type and age, so the more useful comparison is the unit against its own multi-year baseline rather than a single industry number. A steady or improving EAF trend matters more than hitting a specific target figure.
Q
How is EFOR different from availability factor?
Availability factor counts all the time a unit could run, including planned maintenance windows. EFOR isolates only the unplanned, forced portion of unavailable time, which makes it the sharper signal for equipment reliability rather than scheduling.
Q
Why does heat rate drift even without a reportable outage?
Heat rate responds to gradual causes like fouled heat exchangers, worn seals, and drifting control loop tuning, none of which trip the unit on their own. That's why it needs its own continuous tracking rather than being inferred from outage logs.
Turn EAF, EFOR And Heat Rate Into One Live Dashboard
Oxmaint tracks outages, derates, and fuel data by unit so your reliability and efficiency KPIs update continuously instead of at month-end close. Sign up for a free trial to connect your first unit, or book a demo to see it set up for your fleet.