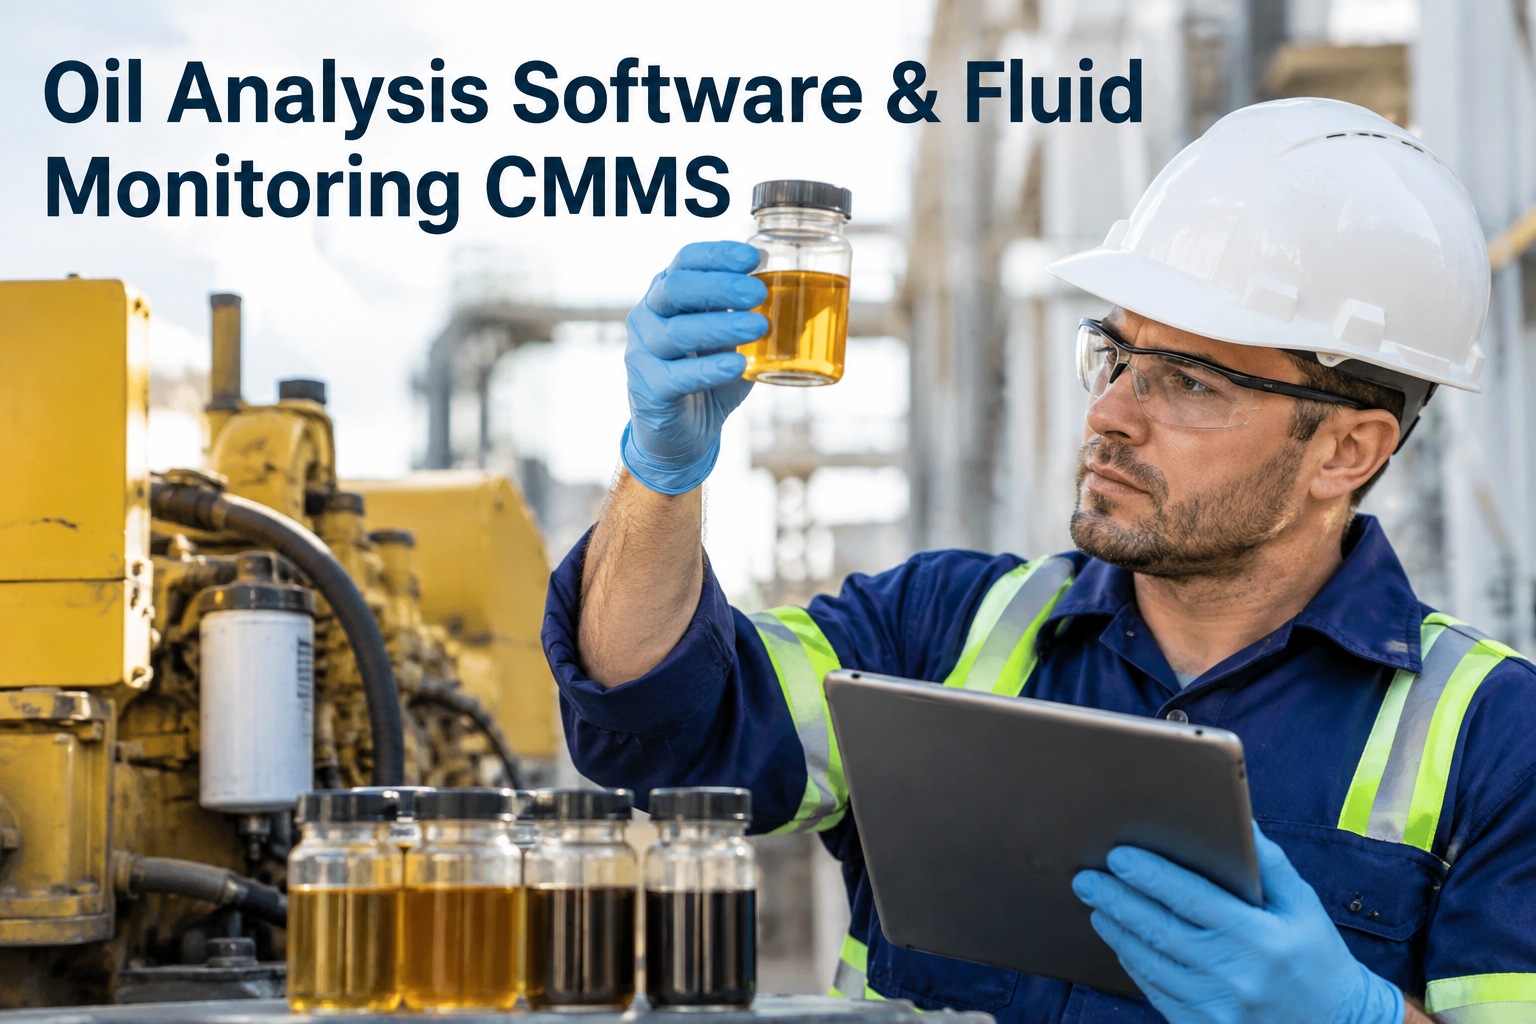
Oil analysis is one of the most powerful condition-monitoring techniques a reliability team has — it detects around 90% of bearing failures through microscopic wear particles well before vibration triggers. The problem in most plants isn't the sampling. It's what happens next: the lab report arrives as a PDF, gets emailed to a maintenance manager, and sits in an inbox. Oxmaint ingests laboratory reports directly, ties each result to the correct asset, trends wear metals and viscosity, and triggers a work order the moment a limit is breached. Book a fluids demo to see oil data drive action.
90%
of bearing failures detectable through oil analysis before vibration alarms
±10%
viscosity deviation from grade — the marginal threshold on almost every industrial oil
4/6/14μm
ISO 4406 particle-count reference sizes for cleanliness codes
What Actually Sits in an Oil Analysis Report
A typical laboratory oil analysis report covers three domains: the condition of the oil itself, the contamination present in it, and the wear debris generated by the equipment. Each domain carries a set of tests, each test carries a threshold, and each breach is a maintenance decision. The trouble is that a PDF doesn't make decisions — a spreadsheet across 30 assets doesn't trend. Understanding what the report actually contains is the first step to turning it into automated maintenance intelligence.
Anatomy of an Oil Analysis Report
Oil Condition
Viscosity — the single most important lubricant property. Deviation over ±10% from ISO VG signals oxidation, fuel dilution or contamination.
Acid Number (AN) — measures oxidation by-products. Rising AN indicates the oil is chemically degrading.
Base Number (BN) — remaining alkalinity in engine oils. Falling BN means the oil is losing its ability to neutralise acids.
Oxidation & nitration — chemical degradation from heat and air exposure over the oil's service life.
Contamination
ISO 4406 particle count — three-digit cleanliness code for particles >4μm / >6μm / >14μm per ml. Hydraulic systems are especially sensitive.
Water content — a destructive contaminant driving rust, corrosion and additive breakdown. Trace levels matter in gearboxes.
Silicon — a proxy for dirt or seal ingress; a rising trend usually points to a seal or breather failure.
Fuel dilution — reduces viscosity, degrades the oil film, applicable to diesel engines and mobile plant.
Wear Debris
Iron (Fe) — from gears, shafts, bearings, cylinders. The most commonly trended wear metal.
Copper (Cu) — bushings, thrust washers, cooler tubes. A rising trend often precedes bearing distress.
Lead / tin — babbitt bearing layers. A 15 ppm rise in lead over a month often signals babbitt erosion.
Chromium, aluminium, nickel — asset-specific wear metals tied to particular components and alloys.
The Three-Colour Rule Every Sample Is Judged Against
Regardless of the lab or the equipment, every oil sample result gets classified into one of three condition bands — normal, marginal, or severe. The band is set by comparing the measured value against a threshold derived from OEM specification, industry standard, or statistical baseline for that asset. Oxmaint applies these thresholds automatically the moment a report is ingested, so a marginal result stops sitting quietly in a PDF and starts driving action.
Normal
Within ±10% of ISO viscosity grade · wear metals within statistical baseline · ISO cleanliness within target
Action: continue routine sampling. No CMMS trigger.
Marginal / Caution
Viscosity ±10-20% · wear metals rising above baseline · water or particle count trending upward
Action: re-sample sooner, review filtration, investigation work order raised.
Severe
Viscosity ≥20% deviation · wear metals spiking · contamination beyond spec · rapid additive depletion
Action: immediate corrective work order — oil change, filtration, component inspection.
Every threshold is asset-configurable — a hydraulic system on a precision press has different tolerances to a gearbox on a slow-speed conveyor. Sign up free to configure oil condition thresholds against your specific asset fleet.
From Sample Bottle to Work Order — the Full Journey
The point of a CMMS-integrated fluids workflow is to close the loop that most plants leave open. A sample gets pulled, sent to the lab, reported back, and then — in most cases — the process stops there. Oxmaint continues the chain: the lab report is parsed, the results are attached to the asset record, trends are updated, thresholds are evaluated, and the corrective work order is raised automatically if any limit is breached.
Sample pulled
Scheduled sampling task in CMMS. Asset ID, sample point and hour-meter reading captured on mobile.
Lab report ingested
PDF or lab feed parsed automatically. Results tied to the correct asset by sample ID — no manual data entry.
Trend evaluated
Result plotted against asset history. Wear metals, viscosity and cleanliness codes trended over the sampling cycle.
Work order triggered
Threshold breach raises a corrective work order — assigned, scheduled, with the underlying lab report attached.
See Oil Analysis Drive Work Orders — Not PDFs
Watch how Oxmaint ingests a lab report, trends wear metals against baseline, and raises a corrective work order automatically when thresholds are breached. Thirty minutes on real fluid data.
Wear-Metal Trending — Where the Real Diagnostic Value Lives
A single result is a snapshot. A trend is a diagnosis. A copper reading of 25 ppm might be normal for a well-worn bushing or a red flag if it's the first appearance in a previously clean sample. Oxmaint plots every sample against the asset's own baseline so the direction of change becomes the signal — not the absolute value. The illustrative view below shows a gearbox where iron and copper are climbing steadily over four sampling cycles while other metals stay flat: the classic signature of gear or bearing wear developing under the surface.
GEARBOX-06 · Wear metals trend (ppm) · last 4 samples
Fe (Iron)
Rising · Severe
Cu (Copper)
Rising · Marginal
Si (Silicon)
Stable · Normal
Viscosity
In grade · Normal
Sample 1Sample 2Sample 3Sample 4 (current)
Expert Perspective — Why Sampled Fluids Beat Fitted Sensors
Oil analysis remains one of the highest-value condition-monitoring techniques available to any maintenance team. It sees wear at a microscopic level long before vibration does, it's non-intrusive to the running machine, and the sampling cost is a fraction of retrofitting sensors on legacy equipment. The value only appears when the results are trended, evaluated against asset-specific limits, and pushed straight into the maintenance workflow.
Trend beats snapshot
A single elevated reading is ambiguous. A rising trend across three cycles is a diagnosis — that's why continuity of history matters.
Thresholds are asset-specific
A hydraulic system's cleanliness tolerance is nothing like a slow-speed gearbox. Universal limits generate noise and get ignored.
Sampling technique matters
A contaminated sample produces misleading data. Standardised sample points and procedures are as important as the lab work.
Close the loop with a CMMS
A lab report emailed to a manager is not a corrective action. Value is realised when the result drives an actual work order.
Who Uses Fluid Monitoring in Practice
The workflow is used by the roles that own rotating-equipment reliability: maintenance managers running hydraulic and gearbox fleets who need condition-based rather than calendar-based oil changes, reliability engineers investigating chronic wear on specific asset classes, mobile-plant supervisors sampling engines and transmissions on scheduled hour intervals, and site directors wanting evidence that predictive-maintenance investment is producing measurable failure reduction. Each role sees the same underlying sample data filtered to their view — fleet dashboard, asset trend, or KPI. Sign up free to configure fluid monitoring for your fleet in the first session.
Getting Fluid Monitoring Live in the First 30 Days
Deployment doesn't require replacing your lab, your sampling routine or your existing CMMS records. Assets and sample points import from spreadsheets on day one. Standard thresholds — ISO viscosity bands, ISO 4406 cleanliness codes, wear-metal defaults per asset class — apply automatically, then narrow to asset-specific limits as your own history builds. Reliability engineers see trended data and threshold-triggered work orders in the first sampling cycle. Sign up free to import your asset and sampling schedule, or book a walkthrough to see fluids on live data.
Turn Every Oil Sample Into a Maintenance Decision
Stop leaving lab reports in inboxes. Oxmaint ingests fluid data, trends wear against asset baselines, and raises corrective work orders the moment a threshold is breached — automatically, with the report attached.
Frequently Asked Questions
Which laboratories can Oxmaint ingest reports from?
Oxmaint accepts lab reports from any major tribology provider — including UK and international labs — via PDF parsing, CSV upload, or direct data feed where the lab supports one. Results are tied to the asset via sample ID or asset tag captured at the point of sampling, so there's no manual matching. Sites using a single preferred lab typically set up an automated feed; sites using multiple labs upload PDFs into the same workflow.
How are thresholds set for our specific equipment?
Thresholds combine three sources: OEM specification where published, industry-standard limits (ISO 4406 cleanliness codes, viscosity grade ±10/20% bands, wear-metal baselines by asset class), and statistical baselines built from your own sampling history as it accumulates. Reliability engineers can override any threshold per asset — a hydraulic system on a precision press won't tolerate the cleanliness code that a slow-speed gearbox does, and Oxmaint reflects that in the alerts each generates.
Can this replace vibration analysis for condition monitoring?
No — the two techniques are complementary and each catches things the other misses. Oil analysis is unrivalled at detecting slow-progressing wear at a microscopic level, contamination ingress, and additive depletion. Vibration excels at rotating imbalance, alignment issues, and late-stage bearing degradation. Sites running mature predictive-maintenance programmes use both, and Oxmaint holds both data streams against the same asset record so the picture is unified rather than fragmented.
How often should we sample?
Sampling frequency depends on asset criticality, operating environment and oil volume. Standard intervals sit between monthly (critical hydraulic systems, large gearboxes) and quarterly (secondary equipment, smaller reservoirs). Mobile plant is often sampled by hour interval rather than calendar. Oxmaint schedules sampling tasks against the asset the same way it schedules any other PPM — with completion evidence and hour-meter capture at the sample point.
Do we still need calendar-based oil changes?
Sites running fluid monitoring at maturity move from calendar-based to condition-based oil changes on suitable equipment — extending intervals where the analysis proves the oil is still fit for service, or shortening them where wear or contamination indicators demand it. The financial and environmental payoff can be substantial, but the shift requires the sampling and trending discipline to justify each decision on evidence rather than expiring the interval on the calendar.