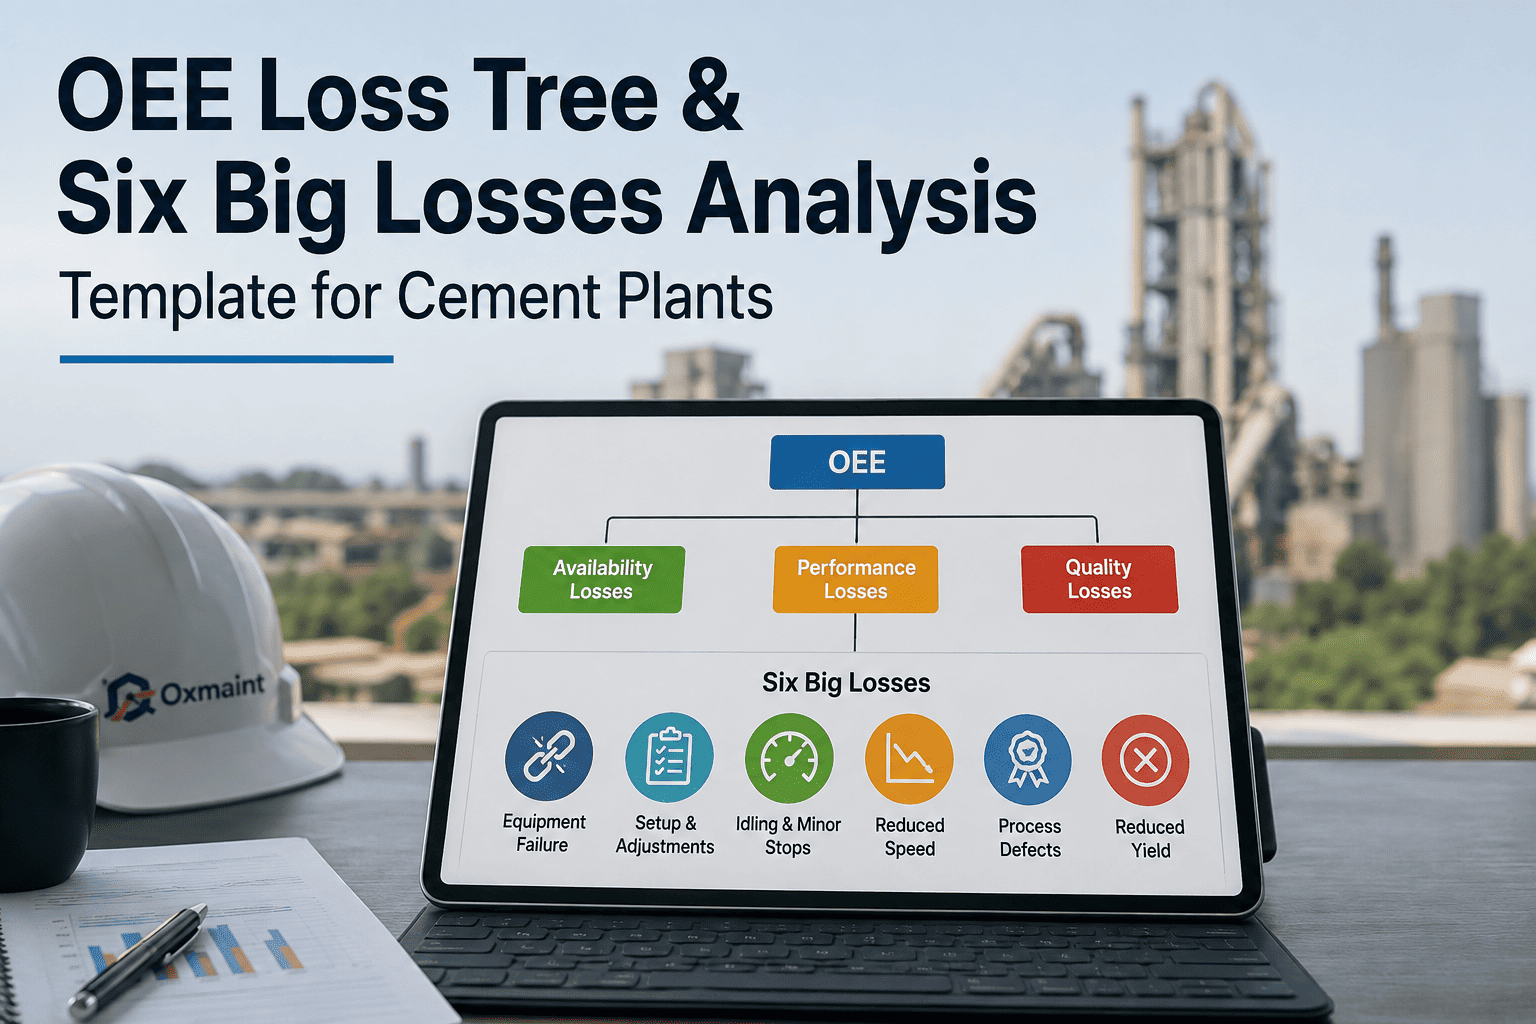
OEE Loss Tree & Six Big Losses Analysis Template for Cement Plants

By Mark strong on August 6, 2026

oee-loss-tree-six-big-losses-template-cement-plant

Most cement plants track OEE every shift, yet the number rarely tells anyone where the tonnage actually went. A kiln that runs at 92% OEE and one that runs at 78% can show the same monthly report if nobody breaks the loss down further. The OEE Loss Tree fixes that by splitting your score into the Six Big Losses so every percentage point points back to a real cause on the plant floor.

Why OEE Alone Hides the Real Losses

A single OEE figure blends three different problems into one number. Availability loss from a stuck damper, performance loss from a slow raw mill feed, and quality loss from off-spec clinker all get averaged together, so the team ends up fixing whatever failed most recently instead of what is costing the most tonnage.

A loss tree separates these three buckets and drills each one down into its own root cause, which is exactly what this free template is built to do for kiln, mill, and cooler data.

The Six Big Losses, Mapped to a Cement Plant

Availability, Performance, and Quality each split into two losses your team already sees on the floor.

AVAILABILITY
Breakdown Loss
Kiln trips, mill bearing failures, and cooler stoppages that stop production outright.
AVAILABILITY
Setup & Adjustment
Changeovers, feed adjustments, and warm-up time after a planned shutdown.
PERFORMANCE
Idling & Minor Stops
Short jams and blockages on conveyors and elevators that never make it into the downtime log.
PERFORMANCE
Reduced Speed Loss
Running the raw mill or kiln below rated feed rate to protect a weak component.
QUALITY
Startup & Yield Loss
Off-spec clinker produced while the kiln stabilizes after every restart.
QUALITY
Quality Defects & Rework
Cement reprocessed or downgraded for missing fineness or strength targets.

How the Loss Tree Connects Back to OEE

The template starts at the top with your plant's OEE score, then branches downward through the three factors and their two losses each, so a drop in the monthly number always has a labeled box underneath it.

Overall Equipment Effectiveness
Availability
Performance
Quality
Breakdown
Setup & Adjustment
Idling & Minor Stops
Speed Loss
Startup & Yield
Defects & Rework

What's Inside the Free Template

Built for plant engineers who want a working sheet, not a theory lesson. Every section maps to data you already log on your CMMS or shift report.

Loss Tree Layout
A ready-made hierarchy from OEE down to all six losses, pre-linked with formulas.
Downtime Log Sheet
Fields for equipment, reason code, and duration so minor stops stop getting missed.
Speed Loss Tracker
Compares rated feed rate against actual, shift by shift, kiln by kiln.
Quality Loss Summary
Rework and rejected batches rolled up against total output for the month.

If you would rather keep this loss tree live against real-time kiln and mill data instead of updating it by hand, you can sign up for a free trial and build it directly on your equipment records, or book a demo to see it mapped to your own plant first.

Q Which loss usually hurts a cement plant's OEE the most?
Breakdown loss and speed loss together tend to dominate, since an unplanned kiln trip stops output completely while a chronic feed-rate reduction quietly caps output every single shift without ever showing up as downtime.
Q Can this template be used for a single kiln line or the whole plant?
Both. Run it per line to find equipment-level root causes, then roll the same six categories up across lines to see which loss is costing the plant the most tonnage overall.
Q Does fixing these losses actually move the OEE number?
Yes. Since OEE is the product of availability, performance, and quality, closing even one recurring loss category compounds across the other two and shows up as a direct lift in the monthly score.

Turn Your Loss Tree Into a Live Dashboard

Oxmaint tracks kiln, mill, and cooler downtime, speed, and quality data continuously, so this loss tree updates itself instead of waiting for a monthly report. Sign up for a free trial to build your own OEE loss tree, or book a demo to walk through it against your plant's data.



Share This Story, Choose Your Platform!




