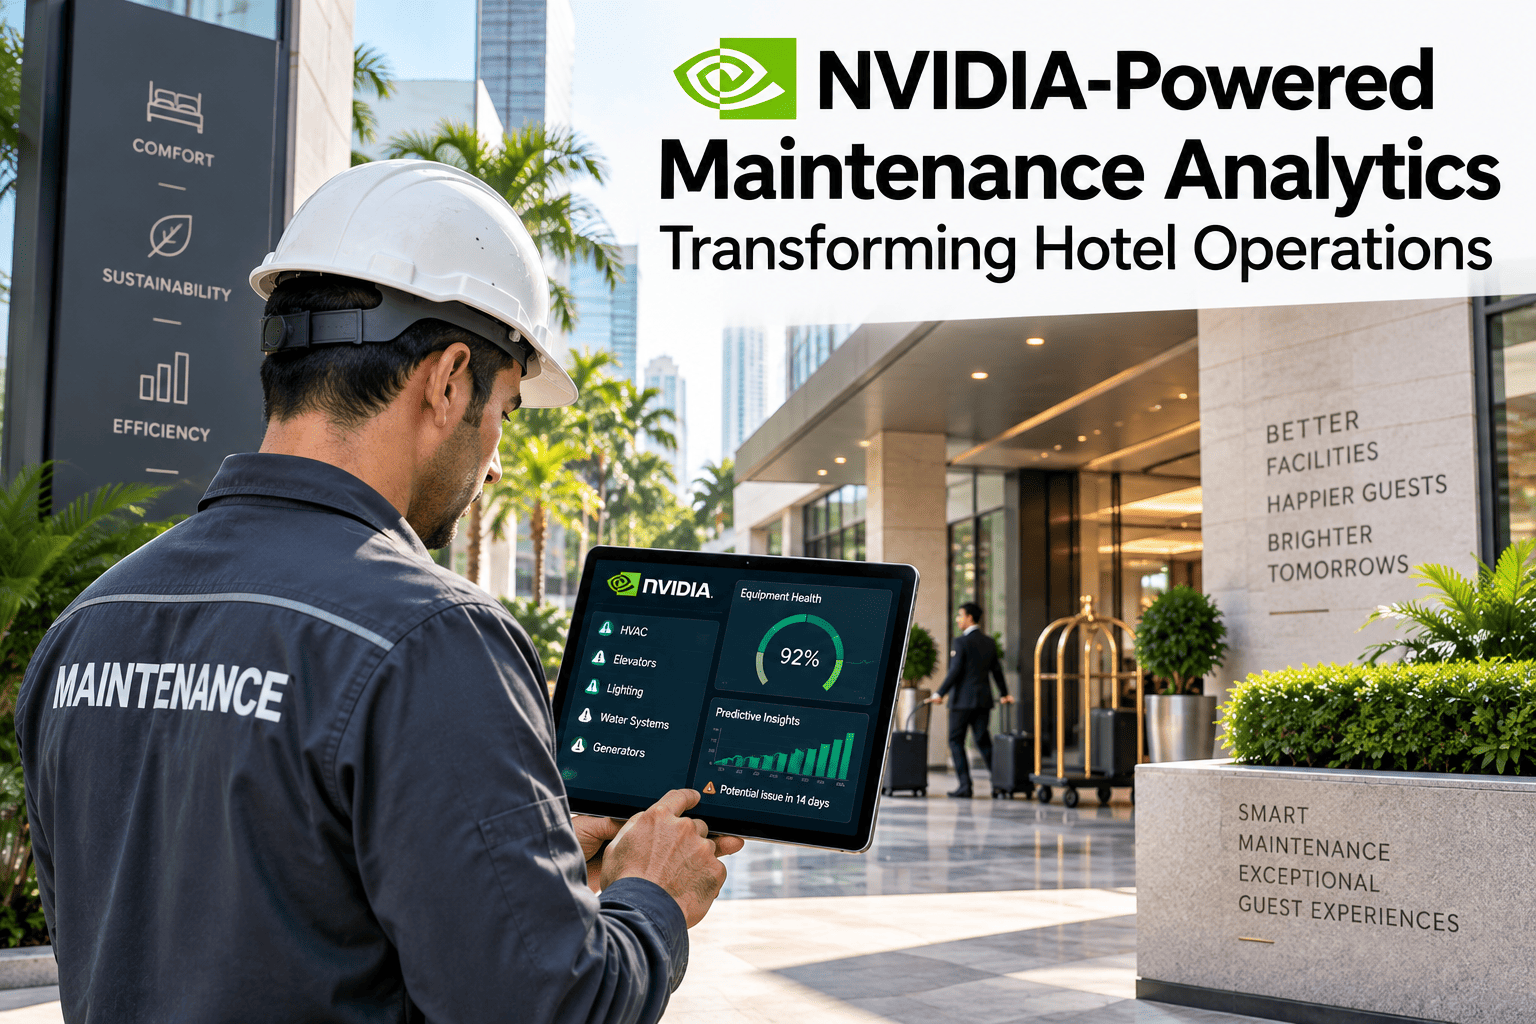
Most hotel maintenance software checks sensor readings in batches — every hour, sometimes only once overnight — because standard CPU processing simply cannot keep up with the volume of data a full property generates in real time. That delay sounds small until you realise a chiller's approach temperature can drift enough to signal an impending fault within minutes, not hours, and by the time an overnight batch job catches it, the early warning window has already closed. GPU-accelerated analytics processes every sensor reading as it arrives instead of waiting for the next batch cycle, running the same pattern-recognition models a data science team would use, but fast enough to act on before a failure happens. Oxmaint's AI analytics layer is built on this GPU-parallel approach so hospitality engineering teams get real-time fault detection across an entire asset fleet, not a delayed report the next morning. Start a free trial or book a demo to see live sensor analytics running against your own property.
GPU-Powered Analytics Are Changing How Hotels Catch Equipment Failures
Sensor data only helps if something is actually reading it in real time, instead of waiting for the next scheduled check. Oxmaint runs GPU-accelerated pattern detection across every chiller, AHU, and PTAC unit on your property, catching multi-sensor warning signs that simple threshold alerts miss entirely because they only ever look at one value at a time, on a fixed schedule, against a single fixed limit.
Why Ordinary Maintenance Software Can't Keep Up With a Hotel's Sensor Data
A mid-size property with per-room climate sensors, chiller telemetry, and building management data can generate millions of readings a day. Conventional maintenance software was never designed to process that volume continuously — it checks values against a fixed limit on a schedule, which means anything that develops gradually between checks simply goes unnoticed until it crosses that limit and triggers a basic alert. By then, the equipment has often already been degrading for days or weeks, and the cheapest, earliest window to intervene has already closed without anyone knowing it existed. GPU processing changes what is even possible here, because instead of checking one value at a time on a schedule, it can run pattern-recognition models against thousands of live data streams simultaneously, the same class of computation used for deep learning everywhere else in the industry, and apply it continuously rather than in occasional bursts.
Give Your Engineering Team Real-Time Eyes on Every Asset
Oxmaint's GPU-accelerated analytics layer reads your property's sensor data continuously, not once a night, so anomalies turn into scheduled work orders while there is still time to act on them.
The Five Layers Behind Real-Time Hotel Maintenance Analytics
GPU acceleration is not a single feature bolted onto a dashboard — it is an entire processing stack running underneath it, from the sensor on the equipment to the work order that lands on a technician's phone. Understanding each layer helps explain why this approach catches faults that older analytics tools consistently miss, and why simply adding more sensors to an existing system does not solve the underlying speed problem. Here is what happens between a reading being taken and a repair being scheduled.
Real Fault Patterns GPU Analytics Catches Before They Reach a Guest
These are not theoretical categories — they are the kinds of gradual, multi-signal drift that show up on almost every property running mechanical HVAC equipment, and the exact patterns a fixed-threshold alert is built to miss because no single reading ever crosses an obvious line until it is too late. Each one below follows the same underlying story: a small deviation appears quietly in the data, grows slowly over days or weeks, and eventually turns into either a guest complaint, an emergency repair, or both — unless something is watching closely enough to catch it while it is still small, inexpensive to fix, and completely invisible to a guest walking through the lobby.
Why a Single Alert Threshold Catches Far Less Than It Seems To
Most building management systems already send an alert when a reading crosses a fixed number. That sounds like coverage, but it only catches the failures that announce themselves loudly and suddenly. The failures that cost the most are usually the ones that build slowly across several signals at once, which is exactly what a single threshold is not built to see. The table below lays out the practical difference between the two approaches, not as an abstract comparison but as the actual gap engineering teams run into every time a fault slips through a threshold alert unnoticed.
| Capability | Fixed Threshold Alerts | Oxmaint GPU Pattern Detection |
|---|---|---|
| Detection Basis | Single reading crossing one fixed limit | Multiple correlated signals scored together in real time |
| Processing Timing | Scheduled checks, often hourly or nightly | Continuous, as each reading arrives |
| Baseline Used | Same fixed limit applied to every unit | Learned baseline specific to each individual asset |
| Early-Stage Faults | Usually missed until the limit is breached | Flagged while readings are still trending, before breach |
| Scale Across Property | Degrades as sensor count grows | Runs every asset stream in parallel regardless of scale |
| Output | Generic alert requiring manual review | Automated work order with asset history attached |
What Real-Time Analytics Typically Changes for an Engineering Team
One Analytics Engine, Whether You Run One Hotel or a Full Portfolio
A single boutique property and a hundred-site hotel group face the same underlying problem — sensor data volume outpaces what a person or a basic alert system can watch manually. GPU-accelerated analytics scales the same way regardless of property count, because the processing load is handled in parallel rather than added one property at a time onto a single overworked server. That matters most for regional facilities teams trying to keep an eye on dozens of sites at once, since the alternative — relying on each property to notice and escalate its own issues — inevitably means the smaller or newer sites in a portfolio get the least attention, right up until something breaks.
GPU-Powered Maintenance Analytics — What Hotel Engineering Teams Ask
What does GPU acceleration actually change compared to normal maintenance software? +
Do I need my own data science team to use this kind of analytics? +
How long does it take to go from connecting sensors to live fault detection? +
Does this replace my existing building management system? +
Is this only useful for large hotel groups with hundreds of sensors? +
Stop Watching Sensor Data Once a Night — Watch It Continuously
Oxmaint's GPU-accelerated analytics reads every chiller, AHU, and PTAC signal on your property in real time, turning early warning patterns into scheduled repairs before guests ever notice a problem.