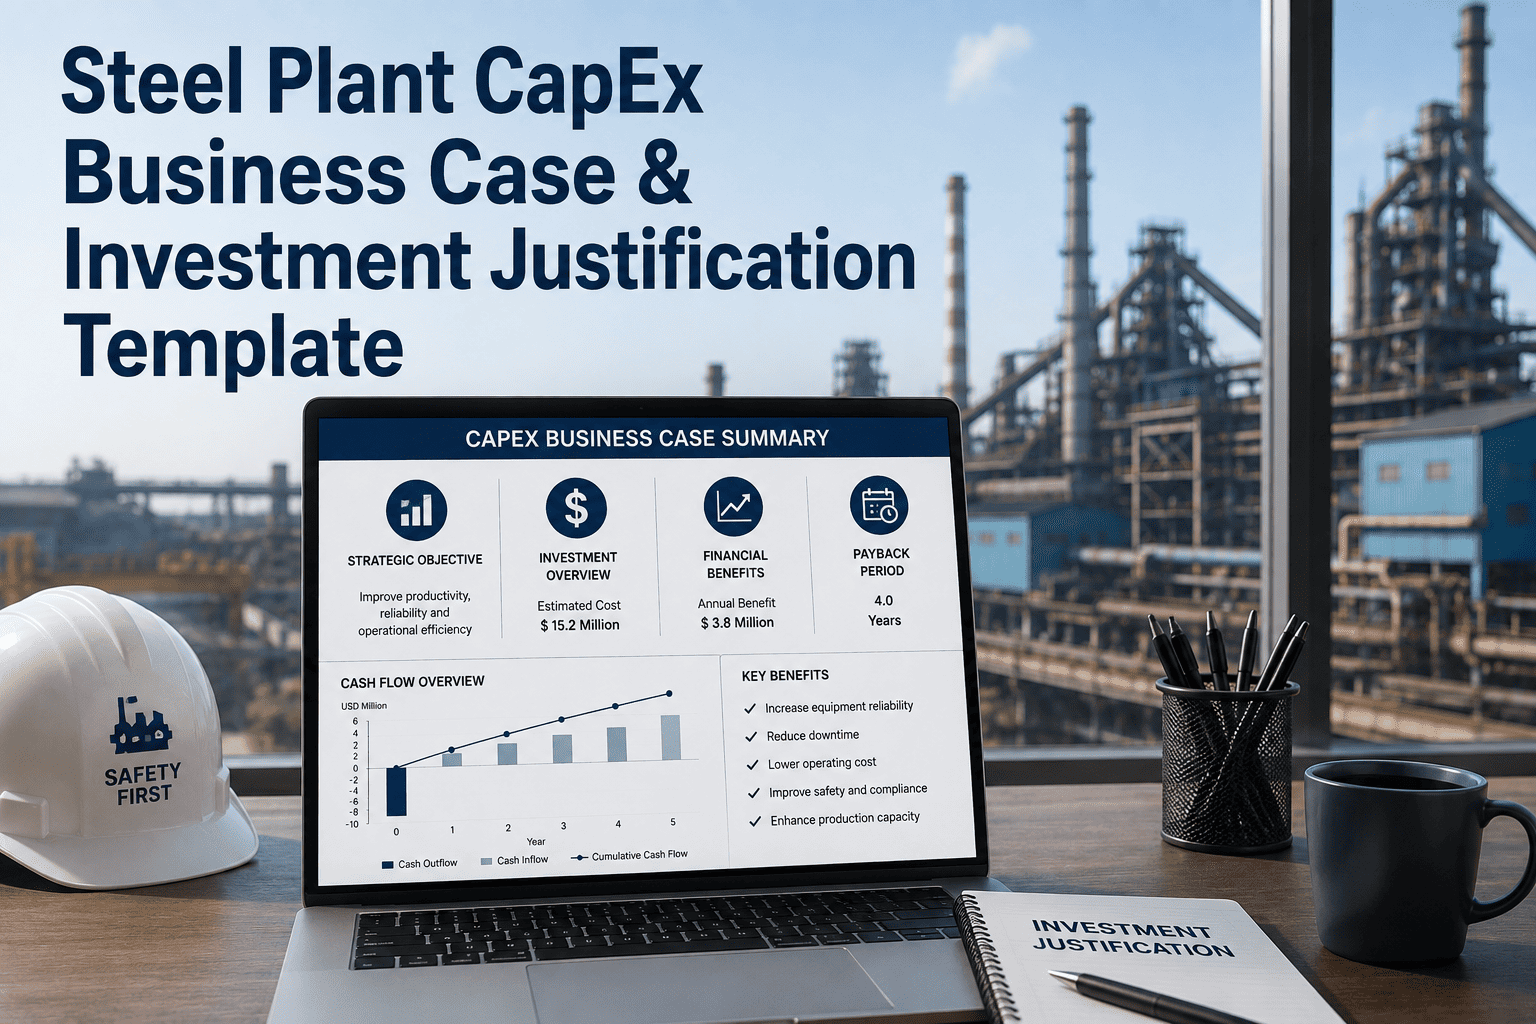
A CapEx request that says "this machine is old and keeps breaking down" gets rejected, not because the problem isn't real, but because it isn't quantified. Finance teams approve numbers, not complaints. A business case that shows ROI, NPV, and a real repair-versus-replace lifecycle comparison moves through approval in weeks instead of getting shelved for another budget cycle. This guide breaks down the financial metrics and lifecycle data every steel plant CapEx business case needs. Start your free trial on Oxmaint or book a live demo to see how maintenance cost history turns into a ready-to-submit business case.
58%
of CapEx requests get rejected due to missing or weak financial justification
3.4yr
average payback period underestimated when lifecycle costs are left out
70%
of asset replacement decisions made without a calculated NPV or IRR
2.1x
faster approval when the case is backed by real maintenance cost history
The 4 Financial Metrics Every CapEx Business Case Needs
A request built around one number, like purchase price, gives finance nothing to evaluate. These four metrics, calculated together, are what turn a request into a defensible case.
01
ROI
Return on Investment shows the net gain from the asset relative to its cost, expressed as a simple percentage.
02
NPV
Net Present Value discounts future savings and revenue back to today's dollars, showing true long-term value.
03
IRR
Internal Rate of Return shows the break-even discount rate, letting finance compare this project against others.
04
Payback Period
The time it takes for the investment to pay for itself through savings, downtime avoidance, or added output.
Pull real maintenance cost data straight into your business case
Oxmaint tracks repair spend and downtime history by asset, ready to feed your ROI and NPV calculations.
How to Build a CapEx Business Case That Gets Approved
A business case that survives finance review moves through a defined sequence, backing every claim with a number instead of an opinion.
1
Define the Problem & Cost of Inaction
The current asset's repair spend, downtime, and failure frequency are quantified to show what continuing costs.
Repair cost history
Downtime quantified
Failure frequency
▼
2
Calculate ROI, NPV, and IRR
Expected savings and gains are modeled against the investment cost using a consistent discount rate.
Consistent discount rate
Savings modeled
Metrics calculated
▼
3
Compare Repair vs. Replace Lifecycle Cost
Total cost of keeping the current asset is weighed against a new asset's cost across its expected life.
Lifecycle cost
Crossover point
Asset life compared
▼
✓
Submit With Risk Assessment & Sign-Off
The case is submitted with a documented risk of inaction and routed for the required approval sign-off.
Risk documented
Approval routed
Case submitted
CapEx Business Case Readiness: The Checklist
Before a business case goes to finance, these five items should be complete. If any box is open, the case is likely to come back with questions.
Problem Quantified With Real Cost Data
Repair spend, downtime, and failure history are pulled from actual records, not estimated from memory.
ROI, NPV, and IRR Calculated
All three metrics are calculated using a consistent, defensible discount rate.
Repair vs. Replace Lifecycle Cost Compared
Total cost of ownership for both paths is compared across the asset's expected remaining life.
Risk of Inaction Documented
Safety, compliance, or production risk from delaying the investment is stated explicitly.
Case Routed for Formal Approval
The completed business case is submitted through the correct sign-off chain, not sent informally.
Before vs. After: Justifying Capital Investment
Without a Structured Business Case
Request based on age or general condition, not cost data
No ROI, NPV, or IRR calculated to support the request
Repair vs. replace cost never compared over asset life
Risk of inaction left unstated or vague
Case rejected or delayed for missing financial detail
With Oxmaint-Backed Business Case
Request built on real repair spend and downtime history
ROI, NPV, and IRR calculated with a consistent discount rate
Lifecycle cost of repair vs. replace compared clearly
Risk of inaction documented with supporting data
Case approved faster with finance-ready justification
Where CapEx Business Cases Get Rejected
| Rejection Reason |
Root Cause |
Fix |
| Finance asks for numbers that weren't included |
The case relies on general condition instead of quantified cost history |
Repair spend and downtime pulled directly from maintenance records |
| Case looks weaker next to other project requests |
No ROI, NPV, or IRR was calculated to compare against other proposals |
All three financial metrics calculated using a standard discount rate |
| Reviewer questions whether repair is actually cheaper |
Repair and replace costs were never compared across the asset's remaining life |
Lifecycle cost comparison included with a clear crossover point |
| Approval stalls with no urgency behind it |
The risk of delaying the investment isn't stated anywhere in the case |
Risk of inaction documented explicitly with safety or production impact |
| Case sits in someone's inbox for months |
The request was sent informally instead of through the approval workflow |
Business case routed through a defined, tracked approval process |
How Oxmaint Powers Your CapEx Business Case
A CapEx request built from memory is easy for finance to push back on. Oxmaint tracks repair spend, downtime, and failure history by asset, giving every business case real numbers to stand on. Start for free and turn your next capital request into a data-backed case ready for approval.
Asset-Level Repair Cost History
Every repair, part, and labor cost is tracked by asset, ready to support the cost-of-inaction section.
Downtime & Failure Frequency Tracking
Unplanned downtime and repeat failures are logged automatically, quantifying the true cost of an aging asset.
Repair vs. Replace Cost Comparison
Historical repair spend is compared against projected replacement cost over the asset's remaining life.
Exportable Financial Reports
Cost history and lifecycle data export directly into the ROI, NPV, and IRR sections of your business case.
Asset Lifecycle Tracking
Age, condition, and maintenance load are tracked per asset, supporting a clear replacement timeline.
Approval-Ready Documentation
Every figure in the business case traces back to a logged work order, standing up to finance review.
Stop Asking. Start Justifying.
Oxmaint gives steel plant teams the maintenance cost history behind every CapEx business case — repair spend, downtime, and lifecycle cost, ready for ROI, NPV, and IRR. Sign up for free or book a demo to see your own asset data turned into a business case.
Frequently Asked Questions
What financial metrics should a CapEx business case include?
A complete case includes ROI, NPV, and IRR calculated with a consistent discount rate, along with a payback period estimate and a lifecycle cost comparison between repairing the current asset and replacing it.
How is NPV different from ROI in a capital investment case?
ROI shows the overall percentage gain from an investment, while NPV discounts future cash flows back to today's value, accounting for the time value of money. NPV gives a clearer picture for investments with returns spread over several years.
Why does a business case need a repair vs. replace lifecycle comparison?
Without comparing total cost of ownership over the asset's remaining life, it's difficult to tell whether continuing to repair an aging asset is actually cheaper or more expensive than replacing it now.
Can Oxmaint provide the maintenance cost data needed for a CapEx case?
Yes. Oxmaint tracks repair spend, downtime, and failure frequency by asset, so the cost history behind a business case is already recorded and ready to export.