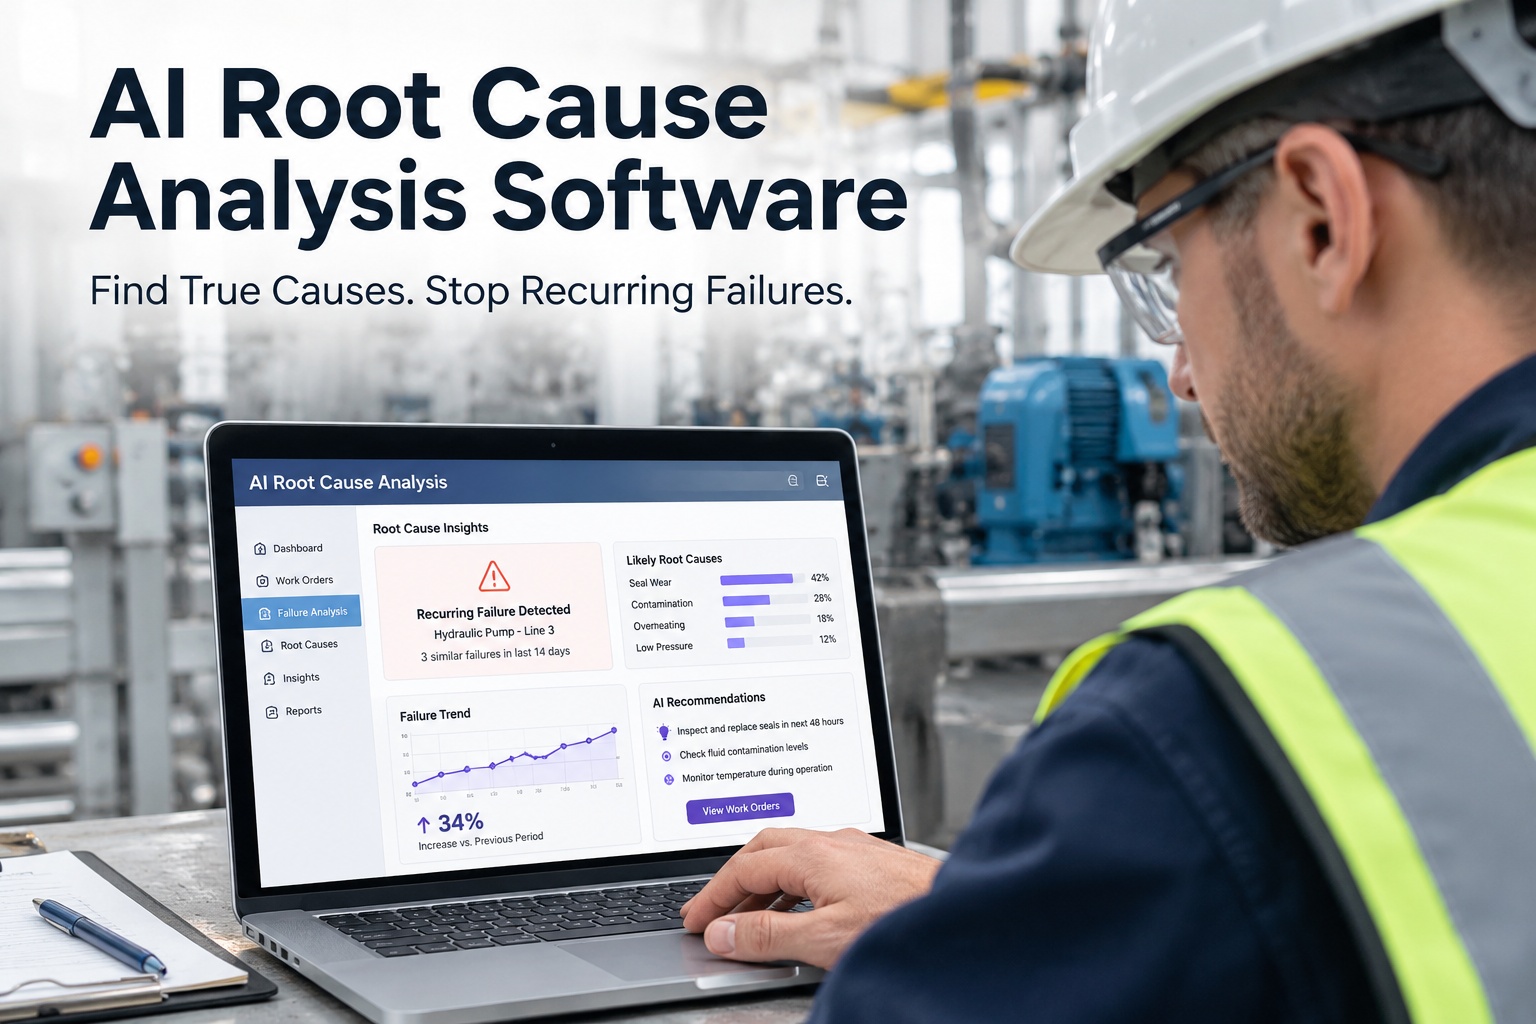
A small handful of assets and recurring failure modes generate most of your unplanned downtime — every reliability engineer knows this, and almost every CMMS holds the evidence in its work order history. The problem isn't the data. It's that manually reading 2,000 closed work orders isn't a job anyone has time to do. Oxmaint's AI reads every closed work order, failure description and corrective action, then surfaces the recurring failure modes and unclosed CAPAs that keep the same problems returning. Book an RCA demo to see AI find your bad actors.
42%
of plant equipment failures are repeat events — the same root cause recurring
10×
faster RCA when AI surfaces past incidents instantly vs manual search
67%
of unplanned stoppages are preventable when prior RCA findings are actioned
Why Manual RCA Doesn't Scale — and What Replaces It
Traditional RCA methods — 5 Whys, fault trees, FMEA — remain the right frameworks. What breaks is the human capacity to apply them consistently across hundreds of failure events per month. Under time pressure technicians fix what broke, close the work order, and move on. The underlying cause is never investigated, the corrective action is never raised, and the same failure resurfaces on the same asset a quarter later. AI-augmented RCA doesn't replace the reliability engineer's judgement — it removes the manual data-hunting that makes formal RCA infeasible for every event.
Manual RCA vs AI-Augmented RCA
Manual RCA
Time per investigationHours to days
CoverageSelected major events only
Pattern detectionRelies on engineer memory
Cross-asset correlationRare — data siloed
Bias riskAnchors on first hypothesis
Institutional memoryLeaves when staff leave
AI-Augmented RCA
Time per investigationSeconds — patterns pre-surfaced
CoverageEvery closed work order
Pattern detectionNLP across full work order text
Cross-asset correlationSame failure mode across asset class
Bias riskRanked hypothesis list with confidence
Institutional memoryHeld in the data, not the person
Finding the Bad Actors in Your CMMS
The reliability engineering term for the small number of assets driving disproportionate downtime is "bad actors" — and a Pareto analysis of work order history reliably shows they exist in almost every plant. The pattern below is drawn from a typical mid-size manufacturing site: roughly 20% of assets generating around 80% of unplanned downtime hours, with a handful of chronic offenders accounting for the largest slice.
Illustrative Bad-Actor Pareto — Downtime by Asset
Typical distribution across a mid-size plant's work order history
Once the bad actors are ranked, the next question is why — and that's where AI reads through every historical work order raised against that asset. Sign up free to run a Pareto against your work order history and see your own bad actors in the first session.
How the AI Actually Reads Your Work Orders
The intelligence isn't magic — it's a specific stack of techniques applied to data your CMMS already holds. Natural language processing reads unstructured failure descriptions and technician notes. Machine learning clusters similar events across time, shift and operating condition. Statistical analysis correlates failure timing against runtime, load, temperature and prior maintenance. The output is a ranked hypothesis list a reliability engineer can act on — not a wall of raw data to interpret.
Asset: EXTRUDER-02 · 14 unplanned stops in 90 days
AI RCA · Ranked Hypotheses
1
Screw wear cluster at 6,000-6,500 run hours
Evidence: 5 of 14 events reference "torque spike" or "wear", all within 400h band. Prior PM schedule sits at 8,000h.
87%
2
Heater band failure on zone 3
Evidence: 4 events reference temperature deviation on same zone. Same replacement part specified in each.
71%
3
Post-changeover start-up condition
Evidence: 6 of 14 events occurred within 90 minutes of a product changeover — suggests procedure gap.
54%
4
Operator skill variance across shifts
Evidence: night shift shows 2.3× incident rate vs day shift on same asset.
38%
See AI Rank the Root Causes on Your Own Data
Bring your closed work order history and watch Oxmaint's RCA engine surface bad actors, cluster recurring failure modes, and rank probable root causes with confidence scores — inside a 30-minute walkthrough.
From Hypothesis to Verified Reliability Improvement
A ranked hypothesis is the start of the workflow, not the end. The reliability engineering value comes from selecting the highest-confidence cause, converting it to a specific corrective or preventive action, implementing it, and then measuring whether time-between-failures actually improves. Oxmaint closes that loop by tracking post-intervention failure rates automatically — if a change to a PM procedure was supposed to eliminate a recurring bearing failure, the system tells you whether it did.
1
Surface the pattern
AI reads work order text, clusters similar failures, and identifies recurring modes across asset classes.
2
Rank the causes
Hypotheses scored by confidence, backed by traceable evidence from the underlying work orders.
3
Act — CAPA raised
Reliability engineer converts hypothesis into a targeted corrective or preventive action with an owner.
4
Measure the outcome
Post-intervention MTBF tracked automatically. If the failure rate doesn't fall, the hypothesis was wrong.
Expert Perspective — What Chronic Failures Actually Cost
Chronic failure modes get accepted as "normal" — that's what makes them the most expensive drain on OEE. The gearbox that fails every six months, the bearing that walks every 6,000 hours, the seal that goes at every changeover. Operators plan around them. Maintenance budgets absorb them. Reliability engineers know they can be engineered out, but only if someone finds the pattern in the data first.
Fixing ≠ solving
Closing a work order isn't the same as closing a failure mode. Repeat repairs are the visible symptom of an uninvestigated root cause.
The data already exists
Years of closed work orders sit in most CMMSs. The intelligence gap isn't data, it's the capacity to read it.
Knowledge walks out the door
When experienced engineers retire, their pattern recognition leaves with them — unless it's held in the system.
Measure the outcome
A CAPA is only proven when post-intervention MTBF actually rises. Without outcome tracking, corrective actions are hope, not evidence.
Who Uses AI RCA in Practice
The RCA engine is used by the specific roles that own reliability outcomes: reliability engineers looking for the bad actors and chronic modes in their fleet, maintenance managers wanting to move planned maintenance intervals off manufacturer defaults onto evidence-based cycles, operations directors measuring whether reliability investment is actually reducing unplanned downtime, and continuous improvement leads running FMEA workshops with real pattern data instead of guesswork. Each role sees the same underlying dataset filtered to their view — ranked bad actors, hypothesis lists, or MTBF trends. Sign up free and run RCA on your existing work order history in the first session.
Getting Started Without a Data Science Team
Deployment doesn't require a data science team or a lengthy integration project. Existing CMMS work order exports import directly — CSV, spreadsheet or API. The AI RCA engine begins pattern detection using Oxmaint's built-in failure mode library within the first session, then improves as your own data accumulates. Reliability engineers see ranked bad actors and hypothesis lists on real assets from day one, not after a six-month rollout. Sign up free to import your work order history, or book a walkthrough to see RCA run on live data.
Turn Work Order History Into Reliability Intelligence
Stop repeating the same repairs. Oxmaint's AI reads every closed work order, surfaces recurring failure modes with confidence scores, and tracks whether your corrective actions are actually reducing recurrence.
Frequently Asked Questions
Does the AI need years of work order data before it produces useful RCA?
No. Pattern recognition begins immediately using Oxmaint's built-in failure mode library, so even in the first weeks the engine can cluster similar events and surface bad actors. Accuracy improves as your own work order and sensor history accumulates — typically around 90 days of operational data produces meaningful asset-specific baselines. Sites with existing multi-year CMMS history can import it and get retrospective pattern analysis on day one.
How is this different from a standard CMMS report?
A standard CMMS report tells you which assets had the most work orders in the last quarter. An AI RCA engine tells you why — clustering unstructured failure descriptions with NLP, correlating events against operating conditions, ranking probable root causes with confidence scores, and tracking whether corrective actions actually reduce recurrence. Reports summarise. RCA investigates.
Does the AI replace our reliability engineers?
No — it removes the manual data-hunting that makes formal RCA infeasible for every failure event. The engineer's judgement, domain knowledge and decision on which corrective action to raise still sits at the centre. What changes is that the engineer starts every investigation with a ranked hypothesis list and evidence chain, not a blank sheet and 500 work orders to read through.
Can this integrate with our existing CMMS if we already have one?
Yes. Oxmaint can run as a standalone CMMS or ingest work order history from an existing system for retrospective RCA. For sites planning a CMMS replacement, the AI RCA engine is one of the reasons the switch pays back — the historical data has more reliability value than most sites realise, and the pattern analysis runs against it immediately.
How do you know whether a corrective action actually worked?
When a recommended action is marked as implemented, Oxmaint begins tracking the post-correction failure rate on that asset and calculates whether time-between-failures has statistically improved. If the intervention isn't reducing recurrence at the expected rate, the system flags the CAPA for reassessment — often surfacing that the true root cause was actually a lower-ranked hypothesis. That outcome-measurement loop is what separates proven reliability improvement from optimistic reporting.