When Nestlé began digitizing its global maintenance network, the company discovered its real problem was not a lack of tools — it was that each of its 400 factories measured reliability differently. Some plants tracked MTBF, others used MTTR, others relied on a homegrown downtime ratio nobody else recognized. Two plants could both report "92% reliability" and mean two entirely different things. After introducing a single standardized dashboard, Nestlé cut reporting time by 70% and lifted overall equipment reliability by 12% within a year. A CMMS like OxMaint calculates every core maintenance KPI the same way at every site automatically, so plant comparisons finally compare the same thing.
Make Every Plant Speak the Same KPI Language
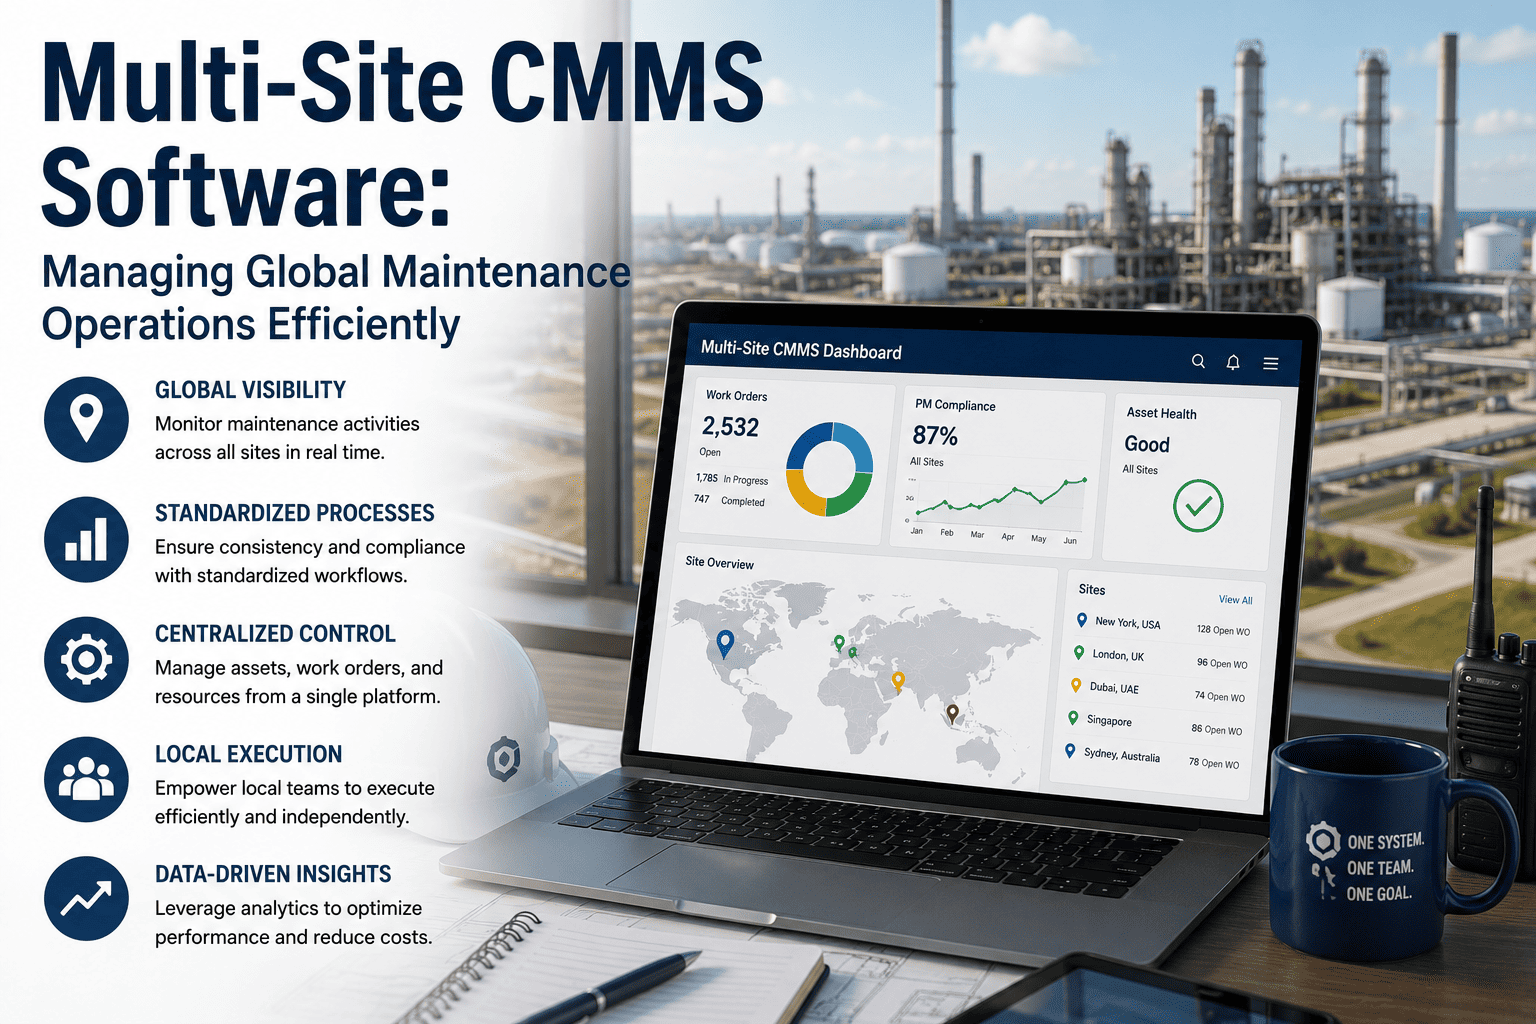
OxMaint calculates MTBF, MTTR, OEE, and PM compliance identically across every facility — automatically, from work order data, with no manual spreadsheet reconciliation.
Why "92% Reliability" Means Nothing Without a Shared Definition
A plant manager reporting strong MTBF numbers may be calculating from work order close timestamps, while a sister plant calculates from technician-logged completion times that run 15 to 30% behind actual repair completion. Both numbers look fine in isolation. Neither is comparable to the other. Book a demo to see how OxMaint removes that ambiguity by computing every KPI from the same data source, the same way, everywhere.
A Three-Tier KPI Hierarchy
Standardization starts with separating metrics into the right altitude. Not every number belongs on an executive dashboard, and not every shop-floor metric needs to reach the board. Sign up free and configure this hierarchy once inside OxMaint — it applies to every facility from day one.
OEE · Maintenance Cost Per Unit · Asset Availability
Reviewed by executive leadership and the board, typically monthly to quarterly
MTBF · MTTR · Planned vs. Reactive Ratio
Reviewed by plant managers and reliability engineers, typically monthly
PM Schedule Compliance · Backlog Age · Work Order Cycle Time
Reviewed by maintenance supervisors and technicians, typically weekly
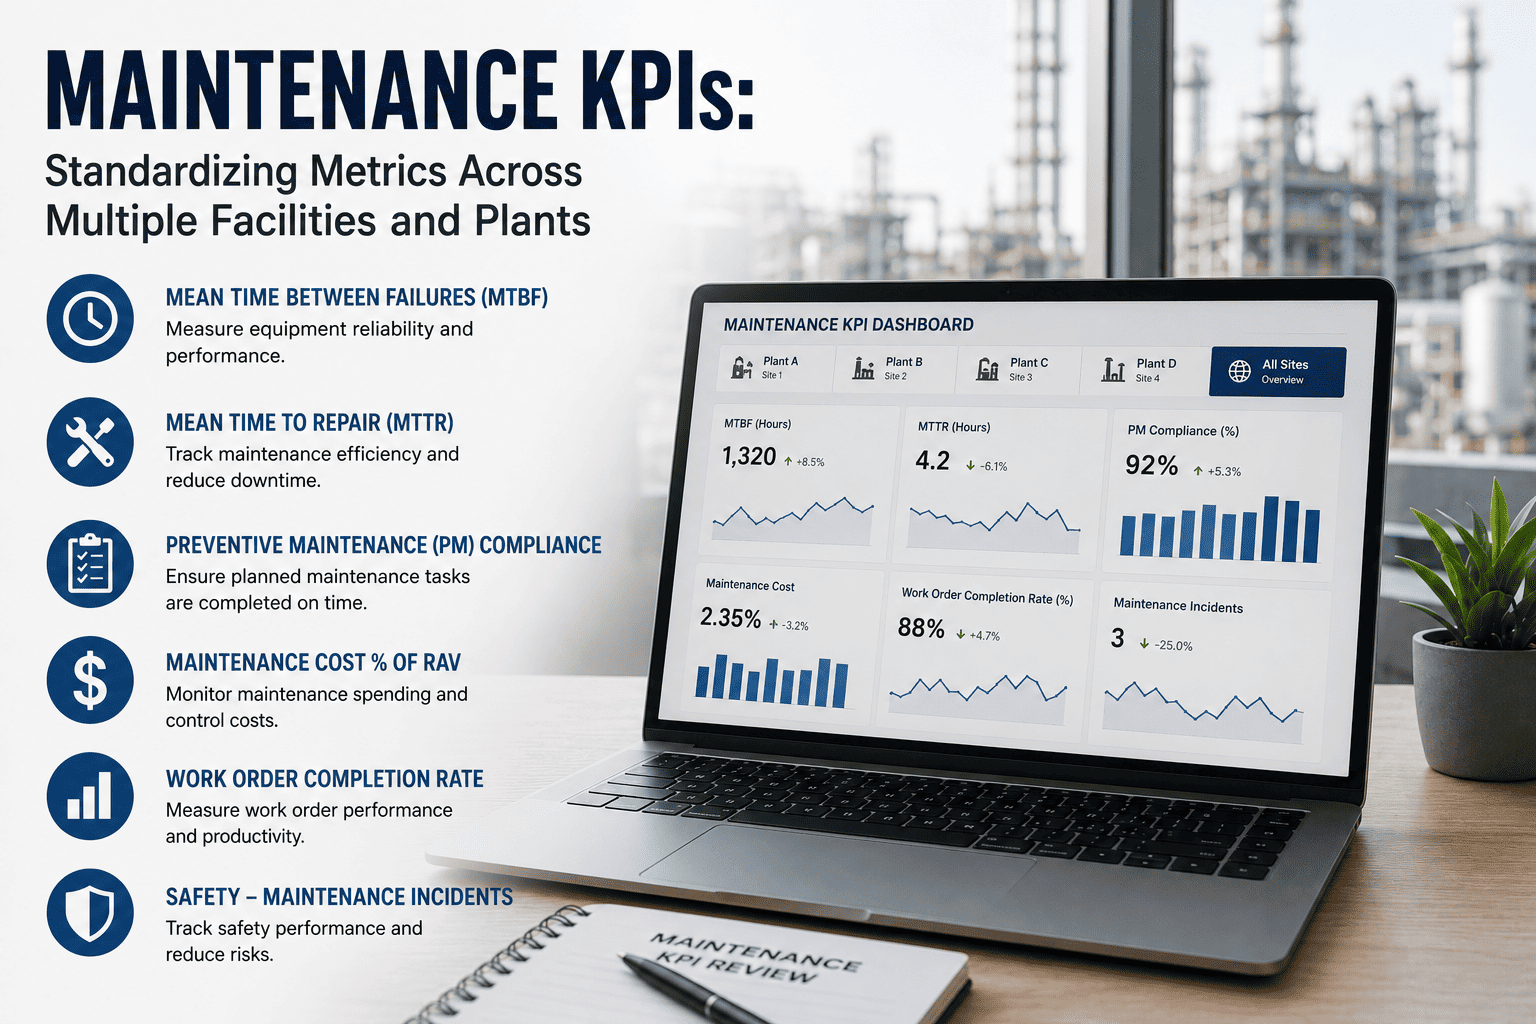
The Core Metrics — Defined the Same Way Everywhere
Total operating hours ÷ number of failures
A pump running 1,200 hours with 4 failures has an MTBF of 300 hours. Higher is better — rising MTBF signals improving reliability.
Total repair time ÷ number of repairs
Three repairs taking 2, 3, and 4 hours average to an MTTR of 3 hours. Above 4 hours on a critical asset is a red flag in most industries.
Availability × Performance × Quality
Most plants run 60–70% OEE. World-class performance is 85%+. Maintenance directly owns the Availability component.
Completed PM tasks ÷ total scheduled tasks
Must be calculated against the full scheduled list, not just tasks that made it into the system — a common source of inflated compliance numbers.
Where Cross-Plant Comparisons Break Down
Different Failure Definitions
One plant logs a "failure" only on full equipment stoppage; another logs any performance deviation. The resulting MTBF numbers are not measuring the same event at all.
Manual Timestamp Errors
Manual work order logging introduces timestamp errors and missing failure codes that directly corrupt MTBF and MTTR. Organizations relying on manual entry commonly underestimate MTTR by 15–30%.
Compliance Calculated Against the Wrong Denominator
PM compliance measured only against tasks that made it into the digital system — rather than the full scheduled task list — inflates the number and hides the real backlog.
Inconsistent Review Cadence
Comparing one site's weekly MTTR figure against another site's monthly average produces a misleading trend line even when the underlying calculation method is identical.
Recommended Review Cadence by KPI Tier
| KPI | Tier | Review Frequency | Why This Cadence |
|---|---|---|---|
| MTTR | Tactical | Weekly | Operational metric requiring rapid response to prevent backlog accumulation |
| PM Schedule Compliance | Operational | Weekly | Drift compounds quickly — a missed week is harder to recover the longer it goes unaddressed |
| MTBF | Tactical | Monthly | Meaningful only as a trend across multiple maintenance cycles, not a single week |
| OEE | Strategic | Monthly / Quarterly | Monthly for plant management, quarterly summary for board-level reporting |
| Maintenance Cost Per Operating Hour | Strategic | Monthly | Normalizes spend against runtime so trends stay meaningful as output varies seasonally |
A Practical Standardization Checklist
Write Down One Definition Per KPI
Document the exact formula and data source for MTBF, MTTR, OEE, and PM compliance once, centrally, and distribute it to every site — not as a suggestion, as the mandatory standard.
Pull Every Calculation from the Same Source
KPIs calculated from work order timestamps in a shared CMMS are inherently comparable. KPIs calculated from a mix of spreadsheets and shift logs at different sites are not, no matter how carefully the formula is documented.
Automate the Calculation, Not Just the Reporting
A shared dashboard that still pulls from manually reconciled spreadsheets inherits all of the original inconsistency. Automate the calculation itself from logged work order data, not just the visualization layer on top.
Set the Review Cadence Per Tier, Not Per Site
Weekly metrics reviewed monthly at one site and weekly at another produce trend lines that cannot be honestly compared, even with identical formulas.
Benchmark Plant Against Plant, Not Just Against Target
Standardized metrics unlock the comparison most organizations actually want — which sites are outperforming, which are falling behind, and what the leading sites are doing differently.
How OxMaint Standardizes KPIs Across Every Facility
Automatic Calculation from Work Orders
MTBF updates every time a corrective work order closes. MTTR auto-calculates from open and close timestamps. No manual spreadsheet reconciliation required at any site.
Portfolio-Level Benchmarking
Compare PM compliance, MTBF, MTTR, and OEE across every plant in one dashboard — because every site's numbers come from the identical calculation logic.
Trend Detection Before Failure
Degradation trend lines surface declining MTBF on a specific asset class weeks before catastrophic failure, rather than waiting for a month-end retrospective review.
Configurable Cadence Per Tier
Set weekly views for operational metrics and monthly or quarterly rollups for strategic KPIs — applied consistently across every facility in the portfolio.
Stop Comparing Numbers That Were Never Comparable
OxMaint calculates MTBF, MTTR, OEE, and PM compliance automatically and identically across every site — giving you a benchmarking dashboard you can actually trust.
Frequently Asked Questions
Why do maintenance KPIs differ so much between plants in the same company?
Most organizations build KPI definitions organically at each site, often before any central standard exists. One plant may define a "failure" as a complete stoppage while another counts any performance deviation, and timestamp logging practices vary depending on whether technicians use mobile devices or end-of-shift paper logs. The result is metrics that share a name but measure fundamentally different things. Sign up free to apply one standardized calculation method across every site in OxMaint.
What is the difference between strategic, tactical, and operational maintenance KPIs?
Strategic KPIs — OEE, maintenance cost per unit, asset availability — are reviewed by executive leadership on a monthly to quarterly basis and inform capital and budget decisions. Tactical KPIs — MTBF, MTTR, planned versus reactive ratio — are reviewed monthly by plant managers and reliability engineers to guide maintenance strategy. Operational KPIs — PM schedule compliance, backlog age, work order cycle time — are reviewed weekly by supervisors and technicians to manage day-to-day execution.
How accurate is MTTR data from manual work order logging?
Manual logging introduces meaningful error. Organizations relying on manually entered timestamps consistently underestimate MTTR by 15 to 30%, because technicians often log completion times rather than the actual repair start time, and missing failure codes further corrupt the calculation. Automated timestamp capture from mobile work order logging removes this source of error entirely. Book a demo to see how OxMaint captures these timestamps automatically.
What OEE score should a plant be targeting?
Most plants run between 60% and 70% OEE under normal operating conditions. World-class performance is generally considered 85% or higher. Since maintenance directly owns the Availability component of OEE, improvements in MTBF and MTTR translate directly into OEE gains — and at scale, even a single percentage point of OEE improvement can represent significant production revenue.
How does a CMMS help standardize KPIs across multiple facilities?
A CMMS like OxMaint calculates MTBF, MTTR, OEE, and PM compliance automatically from work order data using one fixed methodology applied identically at every connected site. Because every facility's numbers are generated the same way from the same type of source data, cross-plant comparisons become genuinely meaningful instead of comparing different measurement systems that happen to share the same metric name.