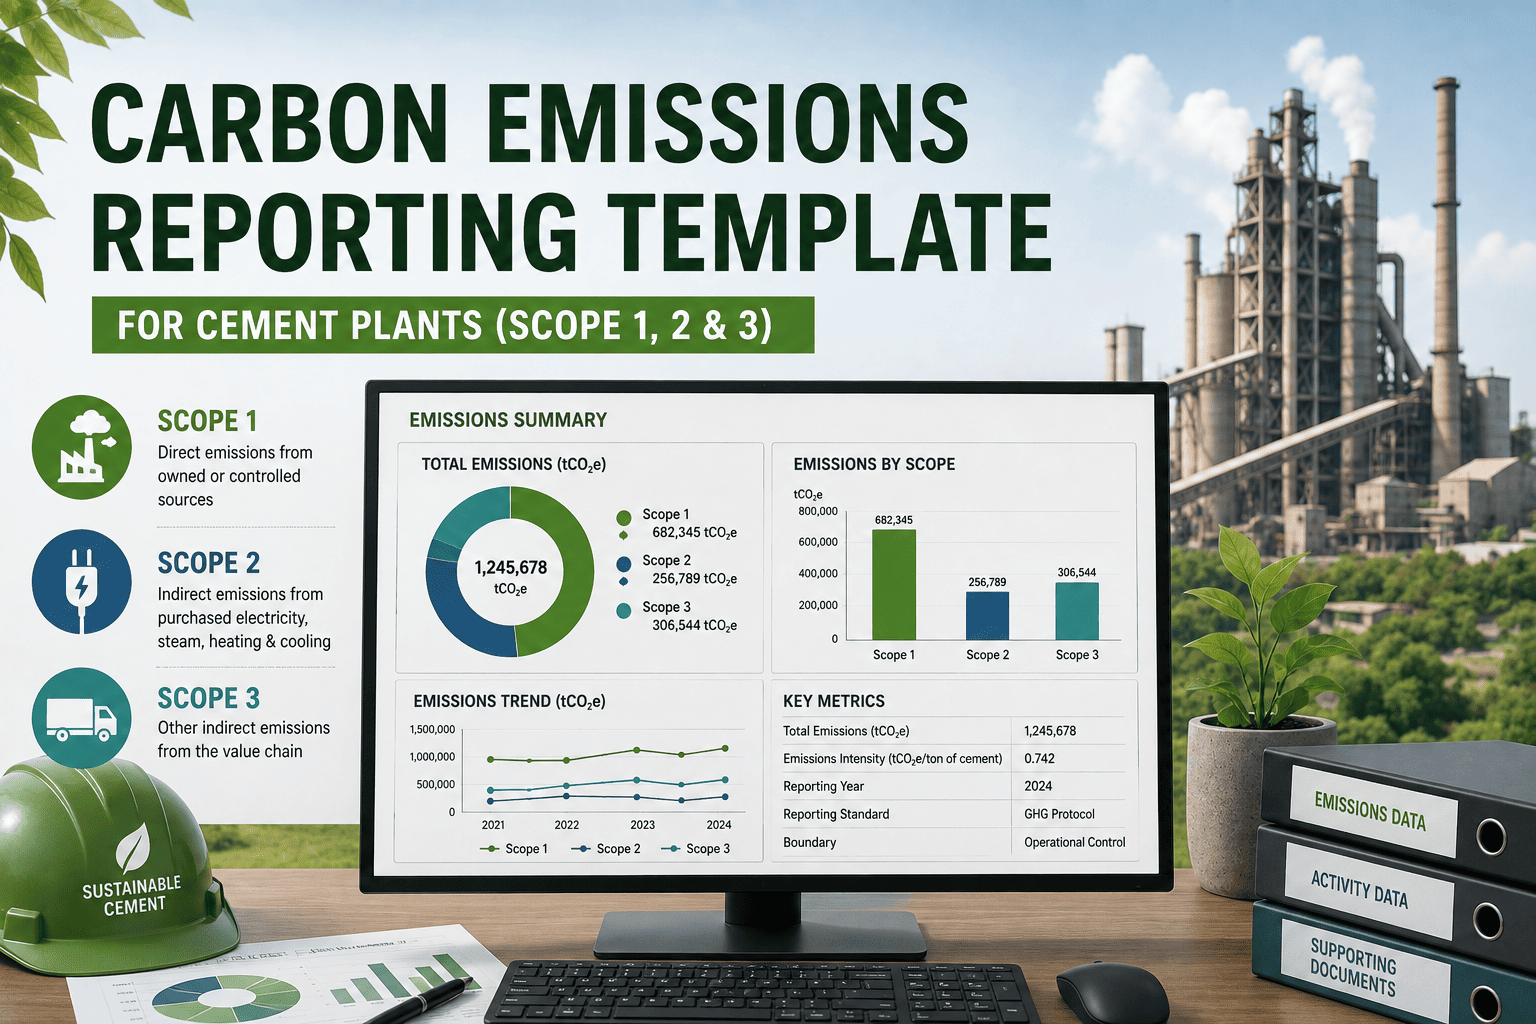
Cement plants sit at an uncomfortable intersection: the sector produces roughly 7-8% of global CO2 emissions, and regulators, lenders, and customers now expect a documented, auditable answer to "what is your carbon footprint, by scope?" Most plants can pull a fuel bill and an electricity invoice. Very few can produce a clean Scope 1, Scope 2, and Scope 3 breakdown that would survive an ESG audit. This template closes that gap — a structured way to capture process emissions from the kiln, purchased energy, and upstream/downstream value chain emissions in one GHG Protocol-aligned format. Sign up for a free trial or book a demo to see how Oxmaint pulls this data automatically from your plant's maintenance and asset records.
~90%
of a cement plant's direct footprint typically falls under Scope 1 — calcination and kiln fuel combustion
15
Scope 3 categories defined by the GHG Protocol Value Chain Standard, most relevant to purchased goods and transport
73%
of large industrial companies still don't publish an independently validated Scope 1 and 2 figure
3
standards a cement plant's report typically needs to satisfy: GHG Protocol, ISO 14064, and the Cement CO2 & Energy Protocol
Why Cement Plants Can't Use a Generic Carbon Template
A generic ESG template asks for "fuel used" and "electricity purchased" and calls it done. A cement plant's emissions profile is more layered than that, and a report that skips the layers won't hold up under scrutiny.
01
Process Emissions Are Separate From Fuel
Calcination of limestone releases CO2 as a chemical reaction, independent of the fuel burned to heat the kiln — both need their own line item under Scope 1.
02
Alternative Fuels Complicate the Math
Co-processing waste, tyres, or biomass in the kiln changes emission factors per fuel stream, and a generic template rarely accounts for blended fuel reporting.
03
Scope 3 Is Where Cement Gets Missed
Purchased clinker, raw material transport, and outbound distribution are Scope 3 categories that most cement plants leave out entirely, understating the real footprint.
04
No Link Between Asset Data and Reporting
Fuel consumption, run-hours, and maintenance records sit in different systems than the sustainability report, so numbers are re-typed instead of pulled live.
Pull your Scope 1 fuel and energy data straight from your CMMS
See how Oxmaint links asset-level fuel and run-hour data directly to your carbon reporting template.
The Three Scopes, Broken Down for a Cement Plant
The GHG Protocol splits emissions into three scopes. For a cement plant, each one pulls from a different part of the operation, and the template needs a dedicated section for each.
1
Scope 1 — Direct Emissions
Calcination process CO2, kiln fuel combustion, on-site vehicles, and fugitive emissions from owned equipment.
2
Scope 2 — Purchased Energy
Grid electricity and purchased steam or heat used to run mills, crushers, conveyors, and plant facilities.
3
Scope 3 — Value Chain
Purchased raw materials and clinker, inbound and outbound transport, employee travel, and waste disposal.
✓
Assurance-Ready Output
Each scope documented with data source, calculation method, and emission factor so a third-party auditor can trace every number.
Building the Report: A Four-Step Workflow
1
Capture Activity Data
Pull fuel consumption by type, electricity bills, run-hours, and raw material tonnage from plant records for the reporting period.
Fuel logs
Electricity bills
Run-hour data
▼
2
Apply Emission Factors
Match each activity to the correct GHG Protocol or national emission factor, including clinker-specific calcination factors.
Calcination factor
Fuel-specific factors
Grid factor
▼
3
Calculate by Scope
Total emissions separately for Scope 1, 2, and 3, then roll them into a plant-level and consolidated company figure.
Scope 1 total
Scope 2 total
Scope 3 total
▼
✓
Document and Report
Record data source and methodology for every figure, then format the output to match GHG Protocol, ISO 14064, or your ESG framework of choice.
Audit trail
ISO 14064 format
ESG-ready export
What Belongs in Every Section of the Template
Scope 1 Process Emissions Line Item
Calcination CO2 calculated separately from kiln fuel combustion, using clinker output tonnage.
Fuel Mix Breakdown
Conventional and alternative fuels listed individually, each with its own emission factor.
Scope 2 Location and Market-Based Figures
Purchased electricity reported both ways, as most ESG frameworks now require both methods.
Scope 3 Category Selection
Relevant categories identified — purchased goods, transport, and waste are the ones cement plants miss most.
Data Source and Method Log
Every figure traceable to its source record and calculation method for audit purposes.
Year-on-Year Comparison Field
Prior period figures included so intensity trends and reduction progress are visible at a glance.
Skip the spreadsheet re-entry
Oxmaint tracks fuel, run-hours, and asset activity in one place, ready to export into your Scope 1-3 template.
Book a Demo
Spreadsheet vs. Connected Reporting
Manual Spreadsheet Reporting
Fuel and energy data re-typed from separate systems each quarter
Process emissions estimated from production totals, not actual kiln activity
Scope 3 categories skipped due to lack of source data
No audit trail linking a figure back to its source record
Report rebuilt from scratch every reporting cycle
Connected, Asset-Level Reporting
Fuel and run-hour data pulled directly from maintenance and asset records
Process emissions calculated from actual clinker output and kiln logs
Scope 3 categories populated from procurement and logistics data on file
Every figure linked to its source record for a clean audit trail
Report regenerated on demand from live plant data
Common Reporting Gaps and How to Fix Them
| Reporting Gap |
Root Cause |
Fix |
| Scope 1 figure understated |
Calcination process emissions not calculated separately from fuel combustion |
Clinker output tonnage used to calculate process CO2 as its own line item |
| Alternative fuel emissions miscounted |
Blended fuel streams reported under one generic emission factor |
Each fuel type — coal, petcoke, biomass, waste-derived — factored individually |
| Scope 3 left mostly blank |
No system linking procurement, transport, and logistics data to the report |
Relevant Scope 3 categories identified upfront and populated from existing records |
| Auditor flags unverifiable numbers |
No documented source or calculation method behind reported figures |
Data source and method logged against every number as the report is built |
| Reporting takes weeks every cycle |
Data manually pulled and re-entered from disconnected plant systems |
Fuel, energy, and asset activity tracked continuously and exported on demand |
How Oxmaint Supports Your Carbon Reporting
Most of the data a Scope 1 and 2 report needs — fuel consumption, run-hours, equipment activity — already lives in your maintenance records. Oxmaint keeps that data structured at the asset level, so building the carbon report is a matter of exporting it, not re-collecting it. Sign up to connect your plant's asset data to your next reporting cycle.
Asset-Level Fuel and Energy Tracking
Fuel consumption and electricity use logged against the kiln, mill, and other equipment generating your Scope 1 and 2 footprint.
Run-Hour and Production Logs
Actual kiln run-hours and clinker output captured for accurate calcination-based process emission calculations.
Vendor and Transport Data for Scope 3
Spare parts and raw material procurement records available to support upstream Scope 3 category calculations.
Exportable, Audit-Ready Records
Every data point time-stamped and traceable to its source, ready to back up figures during an ESG audit.
Build a Carbon Report That Holds Up to an Audit
Oxmaint connects your kiln, mill, and quarry asset data to a Scope 1, 2, and 3 reporting workflow built for cement plants — no re-typing, no gaps, no guesswork.
Frequently Asked Questions
What is the difference between Scope 1, 2, and 3 emissions for a cement plant?
Scope 1 covers direct emissions from calcination and kiln fuel combustion on-site. Scope 2 covers purchased electricity and steam used to run mills and other equipment. Scope 3 covers indirect value chain emissions such as purchased raw materials, transport, and waste disposal.
Why is Scope 1 so much larger for cement than for most other industries?
Cement production involves calcining limestone, a chemical reaction that releases CO2 independent of any fuel burned. Combined with kiln fuel combustion, this typically makes Scope 1 the dominant share of a cement plant's total footprint.
Which Scope 3 categories matter most for cement plants?
Purchased goods and services, fuel-and-energy-related activities, and upstream transportation and distribution are typically the most relevant Scope 3 categories for cement producers, according to GHG Protocol sector guidance.
Can Oxmaint generate a Scope 1, 2, and 3 report automatically?
Oxmaint tracks the underlying fuel, energy, and asset activity data your plant already generates and makes it exportable in a structured format, so building your carbon report draws on connected records instead of manual re-entry.