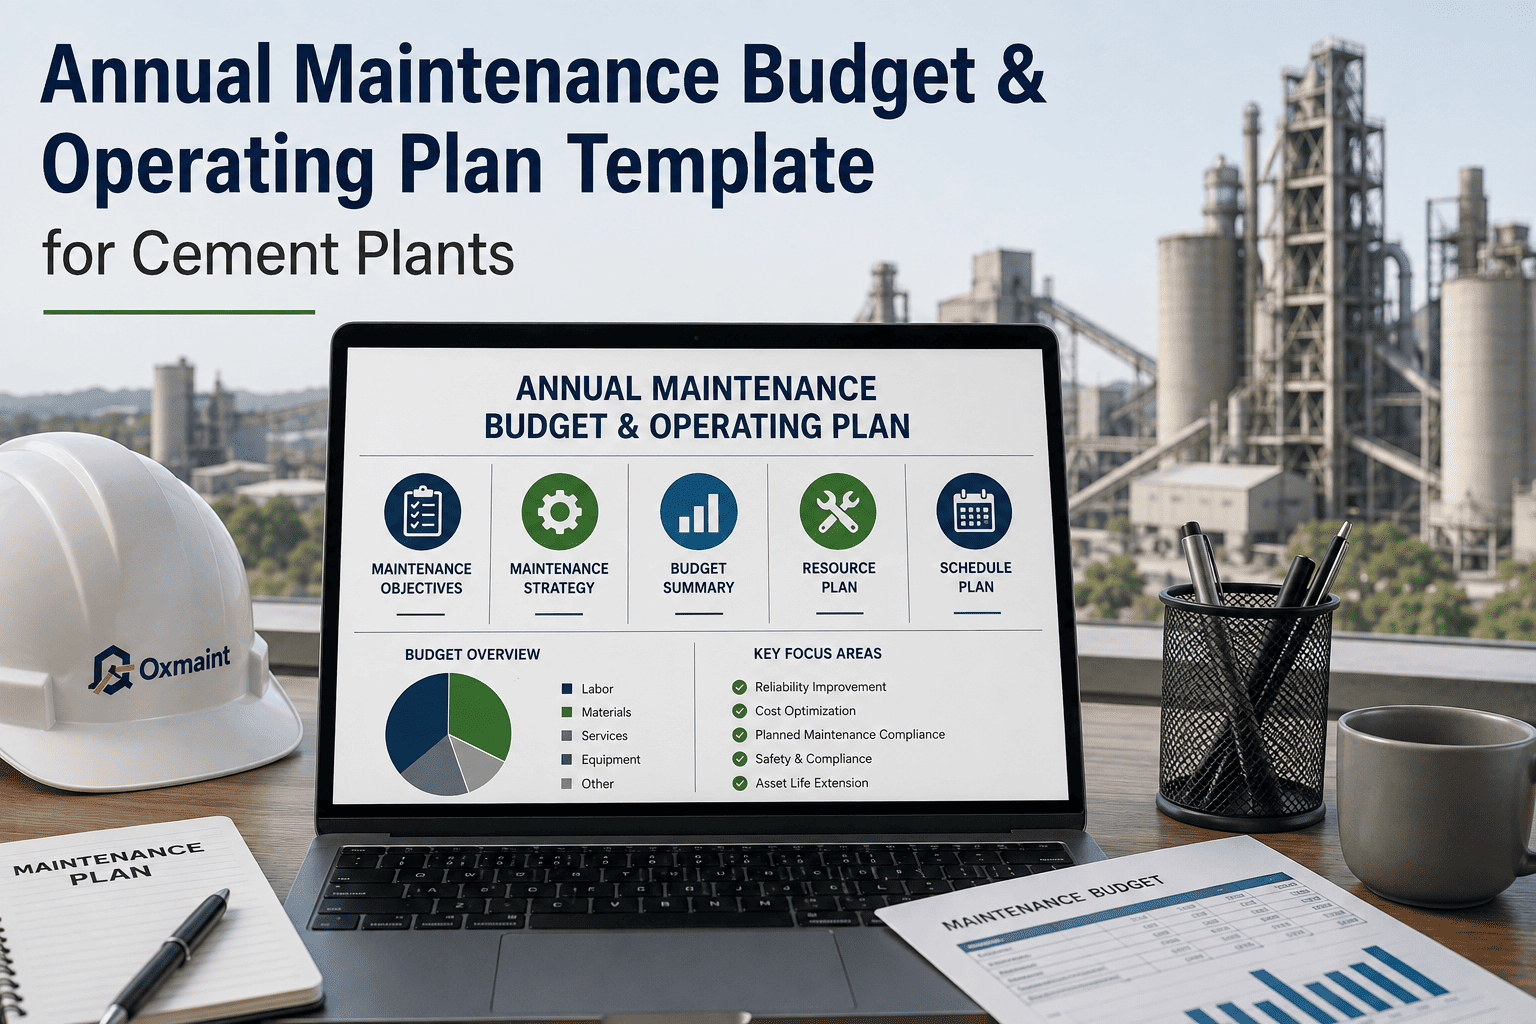
Every cement plant builds an annual maintenance budget, and almost every one of them is wrong by the third quarter. Not because the team can't estimate costs, but because the budget is built on last year's total instead of this year's asset condition, spare parts lead times, and labor plan. This guide breaks down how to build an annual maintenance budget and operating plan that actually holds through the year, and gives you a ready-to-use template covering OpEx, CapEx, labor, and spare parts. Start your free trial on Oxmaint or book a live demo to see how cement plants are forecasting maintenance spend with real asset data.
68%
of cement plants exceed their annual maintenance budget by the third quarter
35%
of maintenance budgets are built by rolling forward last year's total with a flat increase
22%
average variance between planned and actual spare parts spend when demand isn't forecasted
90%
forecast accuracy achievable when the budget is built from asset-level maintenance history
The 4 Gaps That Blow Up a Maintenance Budget
Before you can build a budget that survives the year, you need to know where most maintenance budgets quietly come apart. These four gaps show up in cement plants of every size, and every one is fixable with the right data behind the plan.
01
Budget Rolled Forward, Not Rebuilt
Last year's total gets a flat percentage increase instead of being rebuilt from actual asset condition and planned work for the year ahead.
02
No OpEx and CapEx Separation
Routine maintenance spend and capital replacement costs are blended together, making it impossible to see where the real pressure is coming from.
03
Spare Parts Demand Not Forecasted
Parts are budgeted on historical spend rather than actual failure trends and lead times, leading to both stockouts and overstock in the same year.
04
Labor Plan Disconnected From Workload
Headcount and overtime are budgeted flat across the year, even though planned shutdowns and seasonal demand shift the actual workload significantly.
Build next year's budget on real asset data
Oxmaint turns maintenance history, spare parts usage, and labor hours into a forecast you can defend line by line.
How an Annual Maintenance Budget Comes Together: The Full Planning Workflow
A budget that holds through the year is built in a sequence, not written in a single planning meeting. Each step feeds the next, so the final number is backed by data instead of a guess.
1
Historical Cost Analysis
Pull actual maintenance spend by asset, work type, and month from the past 12 to 24 months to see where money really went, not where it was planned to go.
Cost by asset
Cost by work type
Monthly trend
▼
2
OpEx and CapEx Split
Separate routine maintenance spend from planned capital replacement, so each line can be tracked, forecasted, and justified on its own terms.
Routine OpEx
Planned CapEx
Shutdown budget
▼
3
Labor and Spare Parts Forecasting
Build headcount, overtime, and parts demand from planned PM schedules and shutdown dates instead of a flat monthly average.
Headcount planning
Overtime forecast
Parts demand by lead time
▼
4
KPI-Linked Planning
Tie the budget to targets like planned maintenance ratio and downtime cost, so spend is justified by the performance it's expected to deliver.
Planned vs reactive ratio
Downtime cost target
Backlog target
▼
✓
Board-Ready Operating Plan
All line items are assembled into a single annual plan with monthly phasing, ready to present without a follow-up request for backup detail.
Monthly phasing
Full line-item detail
Variance tracking built in
What a Complete Maintenance Budget Actually Covers
A budget that only shows one number for "maintenance" tells the plant manager nothing. These four categories are what turn a total into a plan that can actually be managed month to month.
O
OpEx
Routine maintenance labor, consumables, and contracted services planned for preventive and corrective work across the year.
C
CapEx
Planned asset replacements and major overhauls, budgeted separately so capital decisions don't get buried in routine spend.
L
Labor Planning
Headcount, shift coverage, and overtime mapped against planned workload, including shutdown and turnaround periods.
S
Spare Parts Budget
Parts spend forecasted from failure trends and lead times, not last year's invoice total divided by twelve.
Stop rebuilding the budget from a spreadsheet every year
Oxmaint keeps asset cost history, labor hours, and parts usage ready for next year's plan automatically.
Book a Demo
Annual Budget Readiness: The Checklist
Before the annual plan goes up for approval, these six items should be complete. If any box is open, the budget is likely to break down before mid-year.
Historical Spend Analyzed by Asset
Actual maintenance cost for the past 12 to 24 months is broken down by asset and work type, not just a single yearly total.
OpEx and CapEx Clearly Separated
Routine maintenance spend and planned capital replacement are budgeted as distinct lines with their own justification.
Labor Plan Mapped to Workload
Headcount and overtime are planned against the actual PM schedule and shutdown calendar, not a flat monthly figure.
Spare Parts Demand Forecasted
Parts budget is built from failure history and lead times for critical spares, not last year's total spend.
Budget Linked to Maintenance KPIs
Planned versus reactive maintenance ratio, backlog, and downtime targets are tied directly to the spend that supports them.
Monthly Phasing and Variance Tracking Built In
The annual total is broken into monthly phases so actual spend can be tracked against plan throughout the year.
Before vs. After: Building the Annual Plan
Without a Structured Budget Process
Last year's total rolled forward with a flat percentage increase
OpEx and CapEx blended into a single maintenance number
Spare parts budgeted on historical invoice total, not demand
Labor plan flat across the year, missed by shutdown periods
Budget exceeded by Q3 with no early variance warning
With Oxmaint-Backed Budget Process
Budget rebuilt each year from actual asset-level cost history
OpEx and CapEx tracked and justified as separate lines
Spare parts forecasted from failure trend and lead time data
Labor plan mapped against the actual PM and shutdown calendar
Monthly variance visible early, before it becomes a Q3 overrun
Where Maintenance Budgets Go Wrong
| Budget Problem |
Root Cause |
Fix |
| Budget exceeded by mid-year |
Plan built by rolling forward last year's total instead of asset-level history |
Budget rebuilt annually from actual cost data by asset and work type |
| Capital requests fight routine spend |
OpEx and CapEx tracked as one combined maintenance line |
OpEx and CapEx separated into distinct, individually justified budget lines |
| Emergency parts orders spike cost |
Spare parts budget based on last year's spend, not failure trend or lead time |
Parts demand forecasted from asset failure history and supplier lead times |
| Overtime spend spikes unexpectedly |
Labor budgeted flat across the year, missing planned shutdown workload |
Labor plan built against the PM schedule and shutdown calendar directly |
| Overrun discovered too late to correct |
Budget tracked only as an annual total with no monthly checkpoint |
Monthly phasing built into the plan with variance tracked as the year progresses |
Key Metrics That Strengthen Your Maintenance Budget
V
Budget Variance
Actual spend versus planned spend by month, catching drift early instead of discovering it at year-end.
P
Planned vs Reactive Ratio
The split between planned and reactive maintenance spend, a direct signal of how well the budget matches real workload.
S
Spare Parts Forecast Accuracy
How closely actual parts spend tracks the forecast, showing whether demand planning is working.
C
Cost per Asset
Maintenance spend tracked per major asset over time, the clearest signal of where next year's budget needs to grow.
90%
forecast accuracy achievable when the budget is built from asset-level maintenance history
22%
reduction in spare parts spend variance once demand is forecasted from failure trends
Monthly
variance visibility instead of discovering an overrun at year-end review
How Oxmaint Powers Annual Maintenance Budget Planning
Cement plants rebuilding their budget from spreadsheets and memory every year are starting from scratch instead of from data. Oxmaint keeps asset cost history, labor hours, and spare parts usage ready year-round, so the next annual plan is built on facts, not last year's guess. Start for free and build a budget your plant can actually hold to.
Asset-Level Cost History
Every maintenance cost is tracked against the asset and work type that generated it, ready to pull into next year's plan.
OpEx and CapEx Tracking
Routine and capital spend are tracked separately, so each budget line can be reported and justified on its own.
Spare Parts Demand Forecasting
Parts usage and failure trends feed directly into a demand forecast, instead of a flat historical average.
Labor Hours and Overtime Tracking
Actual labor hours by shift and work order build a real picture of workload to plan next year's headcount against.
KPI-Linked Budget Reporting
Planned versus reactive ratio, downtime cost, and backlog are tracked alongside spend, not in a separate report.
Monthly Variance Tracking
Actual spend is tracked against the phased annual plan every month, surfacing drift while there's still time to correct it.
Stop Guessing. Start Planning With Real Data.
Oxmaint gives cement plant maintenance teams the asset cost history, labor hours, and spare parts data behind a budget that actually holds through the year, month after month.
Frequently Asked Questions
What should an annual maintenance budget for a cement plant include?
A complete budget includes OpEx for routine maintenance labor and consumables, CapEx for planned asset replacements, labor and overtime planning mapped to workload, spare parts demand forecasting, and KPI targets like planned versus reactive maintenance ratio tied to the spend that supports them.
Why do maintenance budgets usually get exceeded by mid-year?
Most budgets are built by rolling forward last year's total with a flat increase, rather than being rebuilt from actual asset condition, spare parts demand, and shutdown workload. Without monthly variance tracking, the overrun isn't visible until it's already happened.
How is OpEx different from CapEx in a maintenance budget?
OpEx covers routine maintenance spend like labor, consumables, and contracted services that keep equipment running day to day. CapEx covers planned asset replacements and major overhauls. Keeping them separate makes it possible to track and justify each one independently instead of blending them into a single number.
Can Oxmaint help forecast spare parts and labor costs, not just track spend?
Yes. Oxmaint tracks asset failure history, spare parts usage, and labor hours throughout the year, giving you the data foundation to forecast next year's parts demand and labor plan instead of estimating from last year's invoice totals.