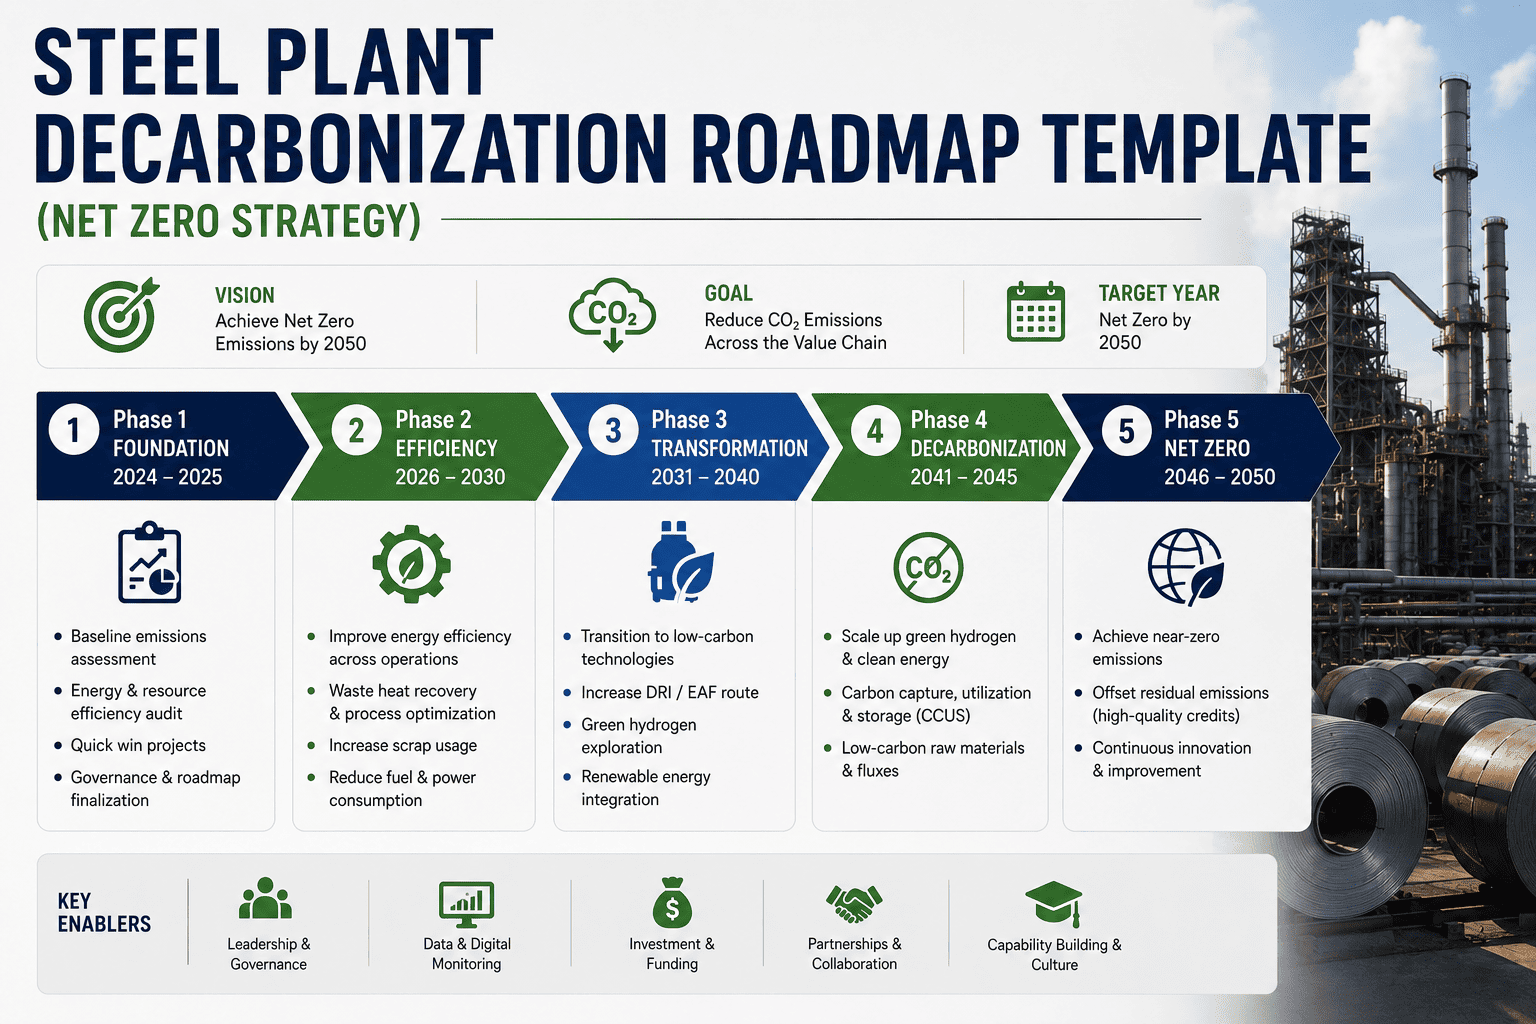
Steel production accounts for roughly 8% of global CO₂ emissions — more than the entire aviation sector — and every tonne made the traditional blast furnace and basic oxygen furnace way emits close to 1.85 tonnes of CO₂. A net zero pledge on a corporate sustainability page doesn't change that number. What changes it is a roadmap tied to plant-level data: which levers you pull first, what they cost per tonne of CO₂ avoided, and whether actual carbon intensity is tracking against the plan or drifting away from it. This template lays out the phased pathway steel plants are actually using — energy efficiency and scrap reuse now, carbon capture and smelt reduction next, green hydrogen steelmaking after that — with the tracking structure to prove progress instead of just reporting it once a year. Sign up for a free trial to start tracking Scope 1, 2, and 3 emissions today, or book a demo to see a live carbon intensity dashboard.
~8%
of global CO2 emissions come from steel production, more than the aviation sector
1.85 t
of CO2 emitted per tonne of steel made through the dominant blast furnace and BOF route
75%
less CO2 emitted by scrap-based EAF steelmaking compared to virgin BF-BOF production
45-50%
of global steel production scrap-based routes could support by 2050, up from about 30% today
Why a Roadmap Needs Plant-Level Data, Not Just a Pledge
Plants that calculate carbon intensity only inside an annual sustainability report can't tell which production periods, process conditions, or raw material combinations pushed emissions above target. A roadmap only becomes actionable once carbon intensity per tonne is tracked continuously and plotted against a committed year-by-year pathway, so drift shows up in weeks, not twelve months later.
01
Energy Efficiency & Scrap Reuse
The cheapest lever available now, often at negative or near-zero cost per tonne of CO2 avoided, through better yield and higher scrap collection rates.
02
Fuel Switching
Shifting furnace and process fuels toward lower-carbon alternatives where the existing process route allows it without a full asset rebuild.
03
Smelt Reduction & Carbon Capture
Technically maturing after 2030, capturing process emissions that fuel switching alone can't reach since the chemistry itself produces CO2.
04
Green Hydrogen DRI-EAF
The long-term route replacing coke with hydrogen as the reducing agent, eliminating process emissions entirely at commercial scale from the 2030s onward.
See where your plant sits against the pathway
Get the roadmap template inside your account and start plotting actual against target.
The Phased Pathway, Timeline, and Cost per Tonne
| Phase |
Primary Levers |
Typical Cost per Tonne CO2 Avoided |
| Pre-2030 |
Energy efficiency improvements and increased scrap reuse |
Roughly -$8.5 to $0.3 per tonne, often net cost-saving |
| 2030-2040 |
Smelt reduction with carbon capture and storage |
Roughly $7 to $75 per tonne depending on region |
| Post-2040 |
Green hydrogen-based DRI-EAF steelmaking at scale |
Roughly $27 to $44 per tonne in early commercial deployment |
Roadmap Readiness Checklist
A Scope 1, 2, and 3 Baseline Is Established
Direct emissions, purchased energy, and upstream materials all need a documented starting point.
Carbon Intensity Is Tracked Continuously
CO2 per tonne of steel should update from process data, not get calculated once a year for the report.
Targets Are Set on a Year-by-Year Trajectory
A single 2050 target isn't enough; the pathway needs interim milestones that can be checked against actuals.
Third-Party Verification Is Built In
Standards like ISO 14064 and initiatives like ResponsibleSteel protect the roadmap's credibility from day one.
Scope 3 Suppliers Are Engaged, Not Just Estimated
Iron ore, coking coal, and purchased energy footprints need real supplier data as procurement requirements tighten.
Each Phase Has an Owner and a Capital Plan
Energy efficiency, carbon capture, and hydrogen readiness each need a named owner and a funded investment case.
Annual Sustainability Report vs. Live Carbon Intensity Tracking
Annual Sustainability Report
Carbon intensity calculated once a year, after the fact
No visibility into which production periods drove emissions up
Scope 3 supplier data estimated rather than measured
Roadmap targets exist on a slide, disconnected from daily operations
Greenwashing risk from unverified, self-reported progress claims
Live Carbon Intensity Tracking
CO2 per tonne updated continuously from live process data
Process conditions and raw material combinations traced to intensity spikes
Scope 3 supplier footprints tracked with real data, not assumptions
Actual performance plotted against the committed pathway in real time
Audit-ready records supporting ISO 14064 and ESG disclosure
How Oxmaint Tracks Your Roadmap
Oxmaint's ESG Reporting and Carbon Tracking module covers everything from blast furnace Scope 1 CO2 to purchased electricity Scope 2 and value chain Scope 3 emissions. Sign up to start tracking your baseline today, or book a demo to see the pathway plotted against your actual data.
Scope 1, 2, and 3 Carbon Tracking
Direct emissions, purchased energy, and value chain footprint tracked in one connected system.
Live Carbon Intensity per Route
CO2 per tonne of steel updated continuously by production route, not recalculated once a year.
Year-by-Year Pathway Tracking
Committed targets entered as a trajectory, with actual intensity plotted against it to show whether you're on track.
Audit-Ready ESG Records
Every data point traceable back to source, supporting ISO 14064 verification and investor or customer disclosure requests.
Turn Your Net Zero Pledge Into a Tracked Pathway
Get the decarbonization roadmap template and start plotting actual carbon intensity against your committed pathway from day one.
Frequently Asked Questions
Why can't steel plants just electrify to cut emissions like other industries?
In a blast furnace, carbon acts as the chemical reducing agent that strips oxygen from iron ore, not just an energy source. That process emission accounts for the majority of steel's carbon footprint and can't be eliminated by switching electricity sources alone, which is why hydrogen-based direct reduction is central to long-term decarbonization.
What is the difference between BF-BOF, EAF, and hydrogen DRI-EAF steelmaking?
BF-BOF uses coke to reduce iron ore in a blast furnace before refining in a basic oxygen furnace, and carries the highest carbon footprint. EAF melts recycled scrap electrically and emits far less CO2. Hydrogen DRI-EAF uses green hydrogen instead of coke to reduce iron ore before melting in an electric arc furnace, targeting near-zero process emissions.
What role does ISO 14064 play in a decarbonization roadmap?
ISO 14064 provides the framework for quantifying and verifying greenhouse gas emissions, giving third-party assurance that reported reductions are accurate. It's increasingly treated as essential to prevent greenwashing accusations as carbon claims face closer regulatory and investor scrutiny.
When will green hydrogen steelmaking reach global scale?
First commercial-scale hydrogen steel plants are targeted for 2025 to 2030, with broader global scale-up expected between 2040 and 2050. Reaching that scale requires roughly two to three times current global green hydrogen production capacity, making it a long-term rather than immediate lever.