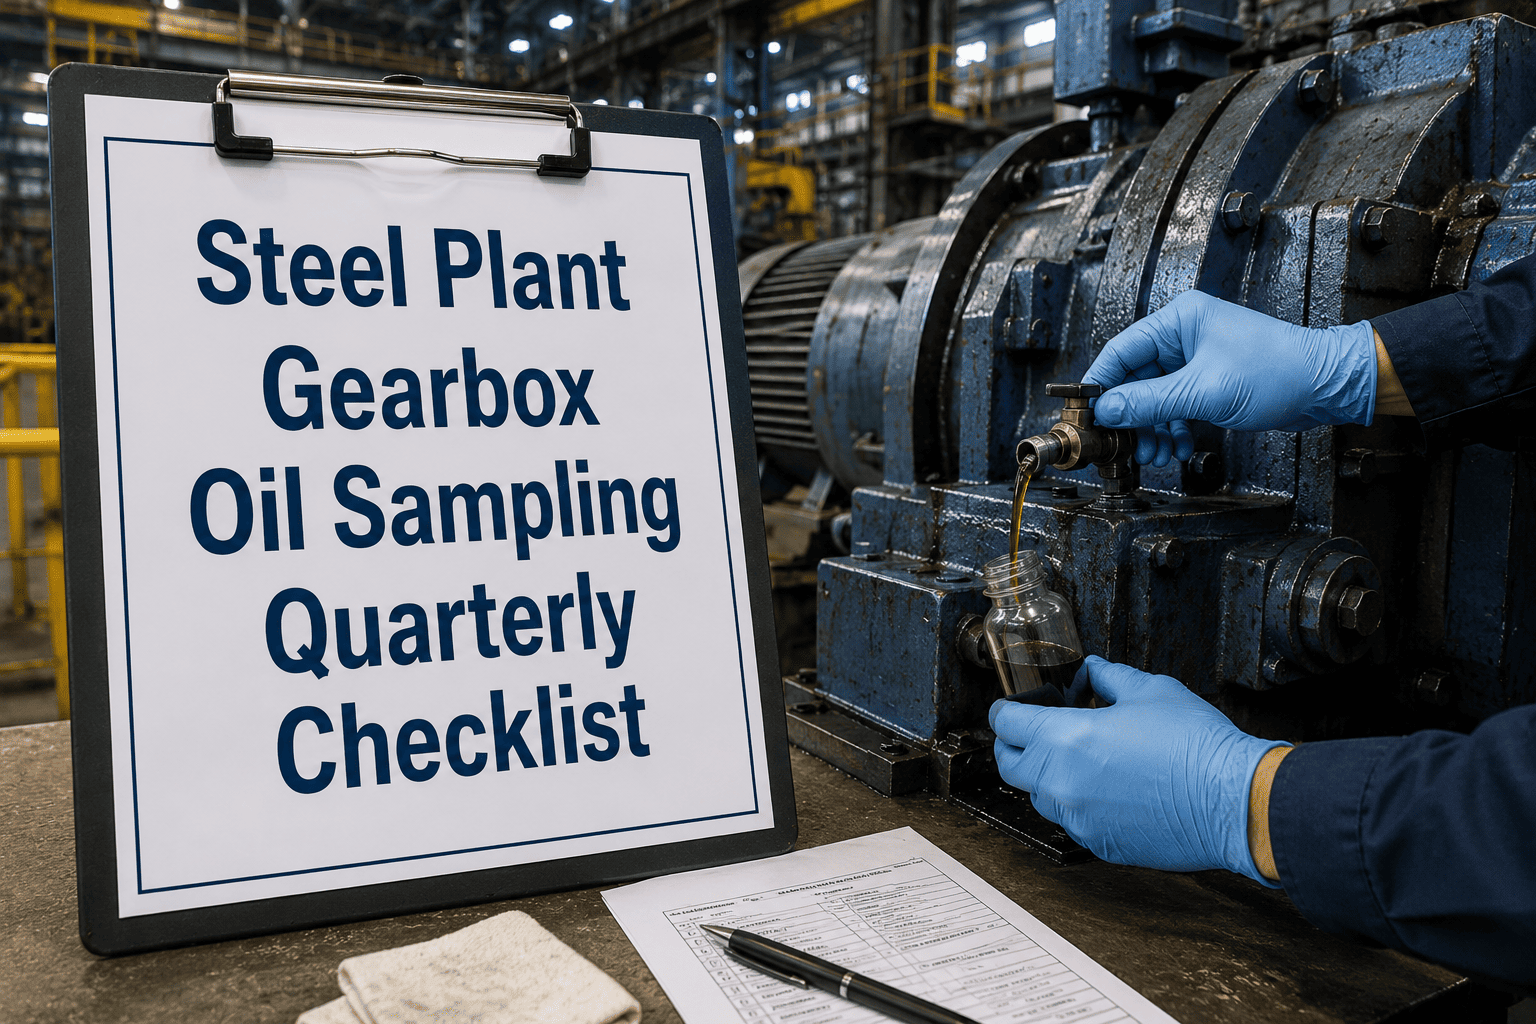
A mill stand gearbox running under constant reversing load doesn't announce a failing bearing with a noise anyone notices on the floor. It shows up first as a wear metal reading climbing on a lab report, weeks before the vibration alarm or the gearbox itself gives any outward sign. Sign up to log every quarterly oil sample against its ISO 4406 baseline and roll it into the same CMMS record as the gearbox's full service history.
Why It Matters
A mill drive or roll stand gearbox failure can shut down an entire line for days, not hours. Oil analysis is the earliest reliable warning available for these units, but only if the sample is drawn consistently, labelled correctly, and trended against a genuine baseline rather than reviewed as a single isolated result each quarter.
What Each Test Actually Reveals
Particle Count
Reported as an ISO 4406 code, this tracks abrasive contamination working its way into the gearbox and signals whether filtration is keeping pace with ingress.
Ferrography
Microscopic examination of wear debris shape and composition, distinguishing normal fatigue wear from a developing gear tooth or bearing failure.
Elemental Spectroscopy
Quantifies iron, copper, and other metals dissolved in the oil, giving a fast read on which internal component is actually wearing.
Quarterly Sampling Checklist
Sample from a turbulent point at operating temperature: draw while the gearbox is running under normal load, never from the bottom of a cold, settled reservoir
Use the same sample point every quarter: a dedicated sampling valve, not a filler cap or drain plug, keeps every quarter's result genuinely comparable
Label with gearbox ID, sample point, and running hours: a result without operating context can't be matched against the unit's own trend line
Request particle count, ferrography, and wear metals together: particle count alone flags a problem, ferrography and elemental data point to its actual source
Compare against the gearbox's own baseline, not a generic target: a 30 percent rise from that unit's commissioning baseline is a stronger signal than any fixed threshold applied plantwide
Log the result against the gearbox's CMMS record: a lab report sitting in an inbox doesn't trend itself, it needs to be attached to the asset history to be useful
Every Sample Trended Against Its Own Baseline
Oxmaint schedules quarterly sampling by running hours per gearbox, stores particle count, ferrography, and wear metal results against each unit's commissioning baseline, and flags a 30 percent rise before it becomes a teardown. Sign up for a free trial to run it on your own gearbox fleet, or book a demo to see it configured for your plant.
A Bad Sample Can Hide A Real Problem
Sampling technique affects the result as much as the condition of the oil itself. A sample drawn from a cold, settled reservoir picks up whatever has drifted to the bottom rather than what's actually circulating through the gears, and can make clean oil look contaminated or miss real debris entirely. A sample point that changes quarter to quarter introduces a second variable into the trend line, so a genuine rise in wear metals can get lost in the noise of inconsistent collection. This is exactly why a dedicated sampling valve at a fixed, turbulent point in the circuit matters more than the sophistication of the lab test applied afterward. The most advanced particle counter can't correct for a sample that was never representative in the first place.
ISO 4406 Targets By Gearbox Type
| Gearbox Type |
Target ISO 4406 |
Sampling Basis |
| General industrial gearbox |
19/17/14 or better |
Quarterly, tied to running hours |
| Mill stand and roll drive gearbox |
18/16/13 or better |
Quarterly, accelerate to monthly if trending |
| High-precision hydraulic gear drive |
16/14/11 or better |
Monthly during commissioning, then quarterly |
Frequently Asked Questions
Q
What's the difference between particle count and ferrography?
Particle count gives a numerical cleanliness code showing how many contaminant particles are present at different sizes. Ferrography examines the shape and composition of that debris under a microscope, which is what distinguishes normal wear from the early signature of a failing gear tooth or bearing.
Q
What counts as a significant change in particle count?
A rise of roughly 30 percent from that gearbox's own commissioning baseline is a widely used trigger for investigation, since it's specific to the unit's actual operating history rather than a fixed number applied across every gearbox regardless of type or load.
Q
Why does the sample point need to stay fixed every quarter?
Contaminant and wear debris don't distribute evenly through a gearbox sump, so drawing from a different port each time introduces a variable that has nothing to do with the actual condition of the oil, making the quarter-to-quarter trend far less reliable.
Catch A Failing Mill Gearbox Before It Stops The Line
Oxmaint ties every quarterly sample to running hours, trends particle count and wear metals against each gearbox's own baseline, and turns an out-of-limit result into a work order automatically. Sign up for a free trial to run it on your own plant data, or book a demo to see it configured for your gearbox fleet.