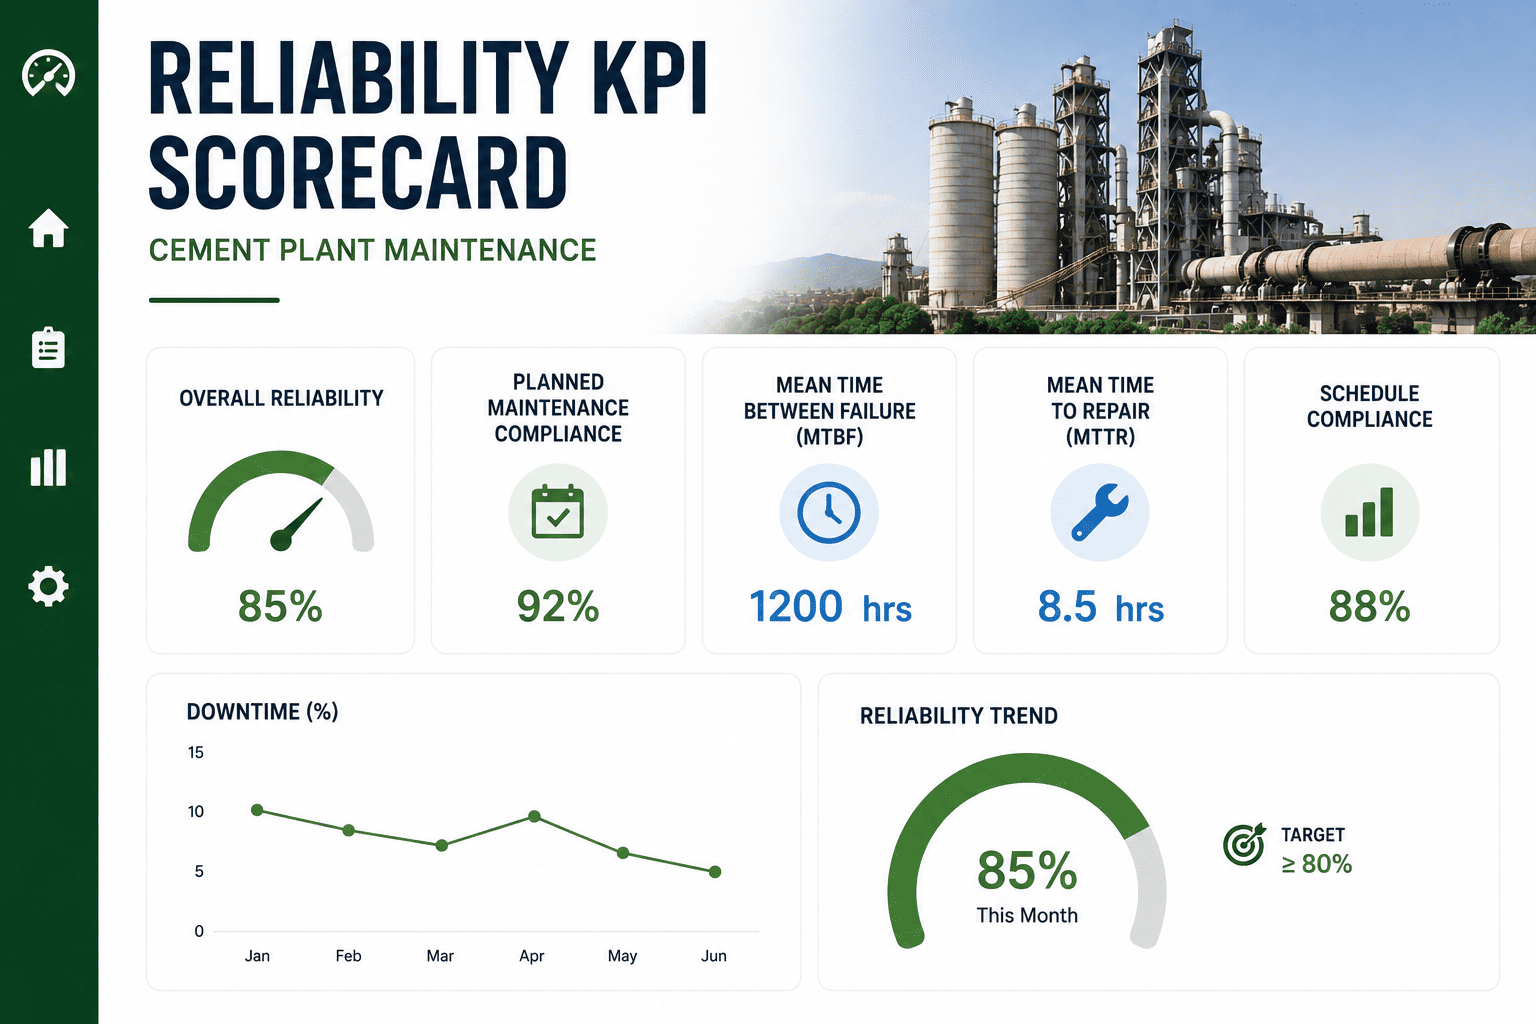
Ask a plant manager how reliable their kiln is, and most will point to last month's downtime report. That's a lagging number, it tells you what already broke. A reliability scorecard flips the view to leading indicators, PM compliance and backlog age, the numbers that predict a failure weeks before it happens. This scorecard template gives cement plants six KPIs, MTBF, MTTR, PM compliance, OEE, backlog, and asset availability, on one page. Sign up to build your own reliability scorecard inside your CMMS.
Why It Exists
Reported PM compliance on paper forms often looks fine while actual execution, verified against required checks and follow-up work orders, runs well below it. A scorecard that pulls straight from work order data instead of manual logs closes that gap before it shows up as an unplanned kiln stop.
The Six KPIs On A Reliability Scorecard
MTBF
Mean time between failures, by asset category, showing how long equipment runs before it breaks
MTTR
Mean time to repair, by maintenance team, showing how fast a fault gets resolved once it's found
PM Compliance
Share of scheduled preventive tasks actually completed on time, the earliest warning of drift
OEE
Availability times performance times quality, the single number that summarizes kiln health
Backlog Age
How long open defects and work orders have sat unresolved, the clearest sign of a stretched team
Asset Availability
Hours the kiln actually ran versus hours it was scheduled to run, tracked per asset
Benchmark Targets By KPI
Planned Vs Reactive Ratio
Above 75% planned
Get A Scorecard That Updates Itself
Oxmaint calculates MTBF, MTTR, PM compliance, and OEE automatically from live work order data, so the scorecard reflects what's actually happening on the floor. Sign up for a free trial to see your first scorecard, or book a demo to walk through it live.
What Makes A Scorecard Trustworthy
Every KPI calculated from work order timestamps, not typed in from memory at shift end
PM compliance verified against required fields and photos, not just a checkbox marked complete
MTBF and MTTR broken out by asset class and team, not blended into one plant-wide average
Backlog age tracked continuously, not recalculated once a month when someone remembers to check
Every number clickable back to the asset, work order, and technician that produced it
Reactive Culture vs Reliability Culture
| Factor |
Reactive |
Reliability-Led |
| Work order mix |
Mostly emergency repairs after something fails |
Over 75% planned, scheduled ahead of failure |
| PM compliance |
Below 80%, with real execution often lower than reported |
Above 90%, verified against completed task fields |
| Cost per repair |
Higher, driven by emergency labor and expedited parts |
Lower, planned work scheduled around parts availability |
| Backlog visibility |
Discovered during audits or after a near miss |
Tracked continuously, aged and prioritized weekly |
The Takeaway
A downtime report tells you what already went wrong. A scorecard built on MTBF, MTTR, PM compliance, and backlog age tells you what's about to, while there's still time to schedule the fix instead of firefighting it.
Frequently Asked Questions
Q
What is the difference between MTBF and MTTR?
MTBF measures reliability, how long a machine runs before it fails. MTTR measures maintenance efficiency, how long it takes to get that machine back up once it fails. A strong scorecard aims for a high MTBF and a low MTTR together.
Q
Why does PM compliance matter more than it looks like it should?
Each 10% drop in PM compliance tends to correspond with a meaningful rise in unplanned failures. It's a leading indicator, a slipping number today predicts a breakdown weeks before it happens, which is why it belongs on the same page as MTBF and OEE.
Q
How often should a reliability scorecard be reviewed?
Leading indicators like PM compliance and backlog age are worth checking weekly. Lagging indicators like MTBF, MTTR, and OEE are best reviewed monthly, with a quarterly look alongside operations leadership to confirm the trend is moving the right way.
Stop Reading Reliability From A Downtime Report
Oxmaint builds your MTBF, MTTR, PM compliance, and OEE scorecard automatically from live work order data, so you see the drift before it becomes a breakdown. Sign up for a free trial to see your first scorecard, or book a demo to walk through it live.