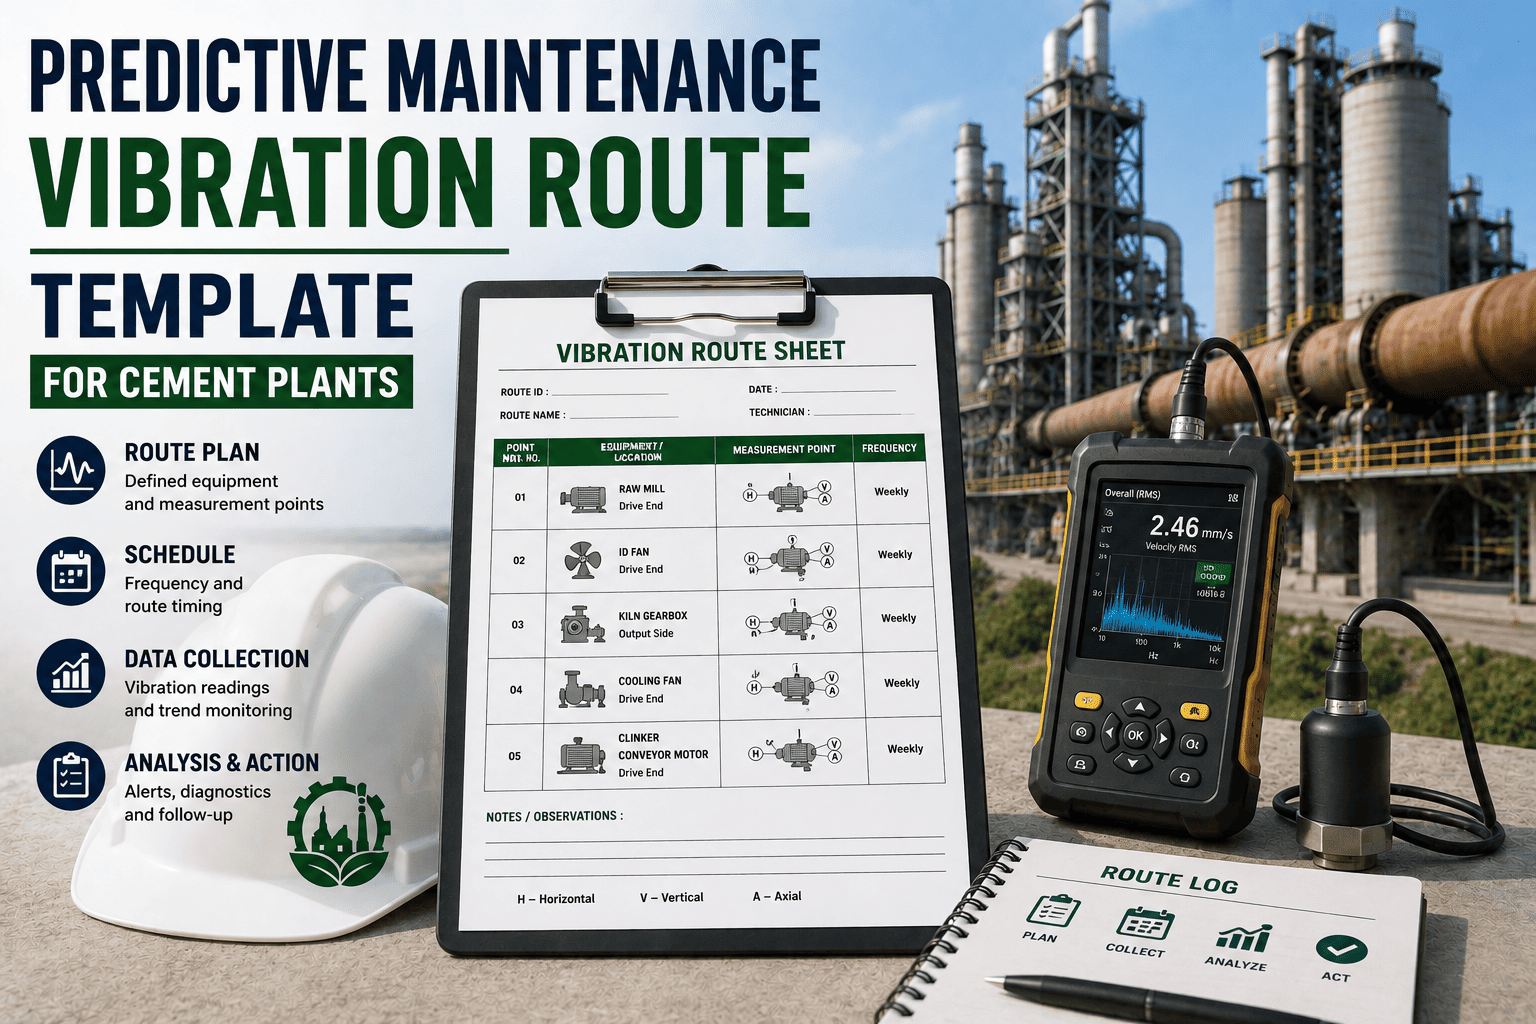
A gearbox bearing starts to fail weeks before it actually seizes, and the vibration signature shows the change long before anyone hears a strange noise or feels excess heat. The problem is most plants only catch that signal if someone walks the same route with the same sensor on the same schedule, every time. This vibration route template gives cement plants a structured path through kilns, gearboxes, motors, fans, pumps, and bearings, so trending data actually builds up instead of getting collected at random. Sign up to run your vibration route through your own CMMS and track the trend automatically.
Why It Exists
A single vibration reading tells you almost nothing on its own. What matters is the trend over time, and a trend only forms if the same points on the same equipment get measured the same way, on a route, rather than whenever someone remembers to check.
Vibration Severity Zones
Every reading on the route gets classified into one of these zones against the equipment's baseline, so a shift from Good to Satisfactory raises a flag long before anything reaches Unacceptable.
A Typical Vibration Route
1
Kiln Drive
Main gear, pinion bearings, and girth gear mesh
2
Gearboxes
Input and output shafts on mill and cooler gearboxes
3
Main Motors
Drive and non-drive end bearings on critical motors
4
ID And Cooler Fans
Fan bearings and shaft, checked for imbalance and misalignment
5
Pumps
Slurry and cooling water pump bearings and coupling alignment
6
Support Bearings
Kiln support rollers and other standalone bearing points
Let The Trend Build Itself
Oxmaint logs every vibration reading against the same point on the same asset, so the trend line builds automatically and a shift toward Unsatisfactory raises a work order before it becomes a breakdown. Sign up for a free trial to load your own route, or book a demo to see the trending in action.
What To Capture At Each Point
Overall vibration velocity or acceleration, recorded in the same units and axis every time
Sensor placed at the exact same measurement point, marked so every technician finds it the same way
Operating conditions at time of reading, including load and speed if the asset runs variable duty
Any audible or visible abnormality noted alongside the numeric reading
Severity zone assigned against the asset's own baseline, not a generic plant-wide limit
Route-Based Monitoring vs Random Checks
| Factor |
Random Checks |
Route-Based Monitoring |
| Measurement points |
Vary by whoever's doing the check that day |
Fixed and marked, so every reading is comparable |
| Trend visibility |
Hard to build a trend from inconsistent data |
Clear trend line builds up reading after reading |
| Coverage |
Easy for a piece of equipment to get missed |
Every asset on the route gets checked, every cycle |
| Early warning |
Failures usually spotted after symptoms appear |
Zone shifts flagged before a failure ever shows up |
The Takeaway
Vibration data is only predictive if it's consistent. A route that hits the same points on the same schedule turns scattered readings into a trend line the maintenance team can actually act on, catching a bearing fault weeks before it becomes an unplanned shutdown.
Frequently Asked Questions
Q
How often should a vibration route be walked?
Critical assets like kiln drives and main motors are often checked monthly or more frequently, while less critical rotating equipment may be checked on a longer cycle, depending on the asset's failure history and criticality rating.
Q
What's the difference between a baseline and a severity zone?
A baseline is the normal reading for a specific asset when it's running healthy, while severity zones classify how far a new reading has drifted from that baseline, from Good through to Unacceptable.
Q
Can a vibration route be linked to automatic work order creation?
Yes, in a CMMS a reading that crosses into the Unsatisfactory or Unacceptable zone can trigger a work order automatically, so the finding turns into action instead of sitting in a spreadsheet.
Catch The Fault Weeks Before The Failure
Oxmaint turns your vibration route into a trend line that flags drift before it becomes a breakdown. Sign up for a free trial to set up your own route, or book a demo to see it running on your equipment.