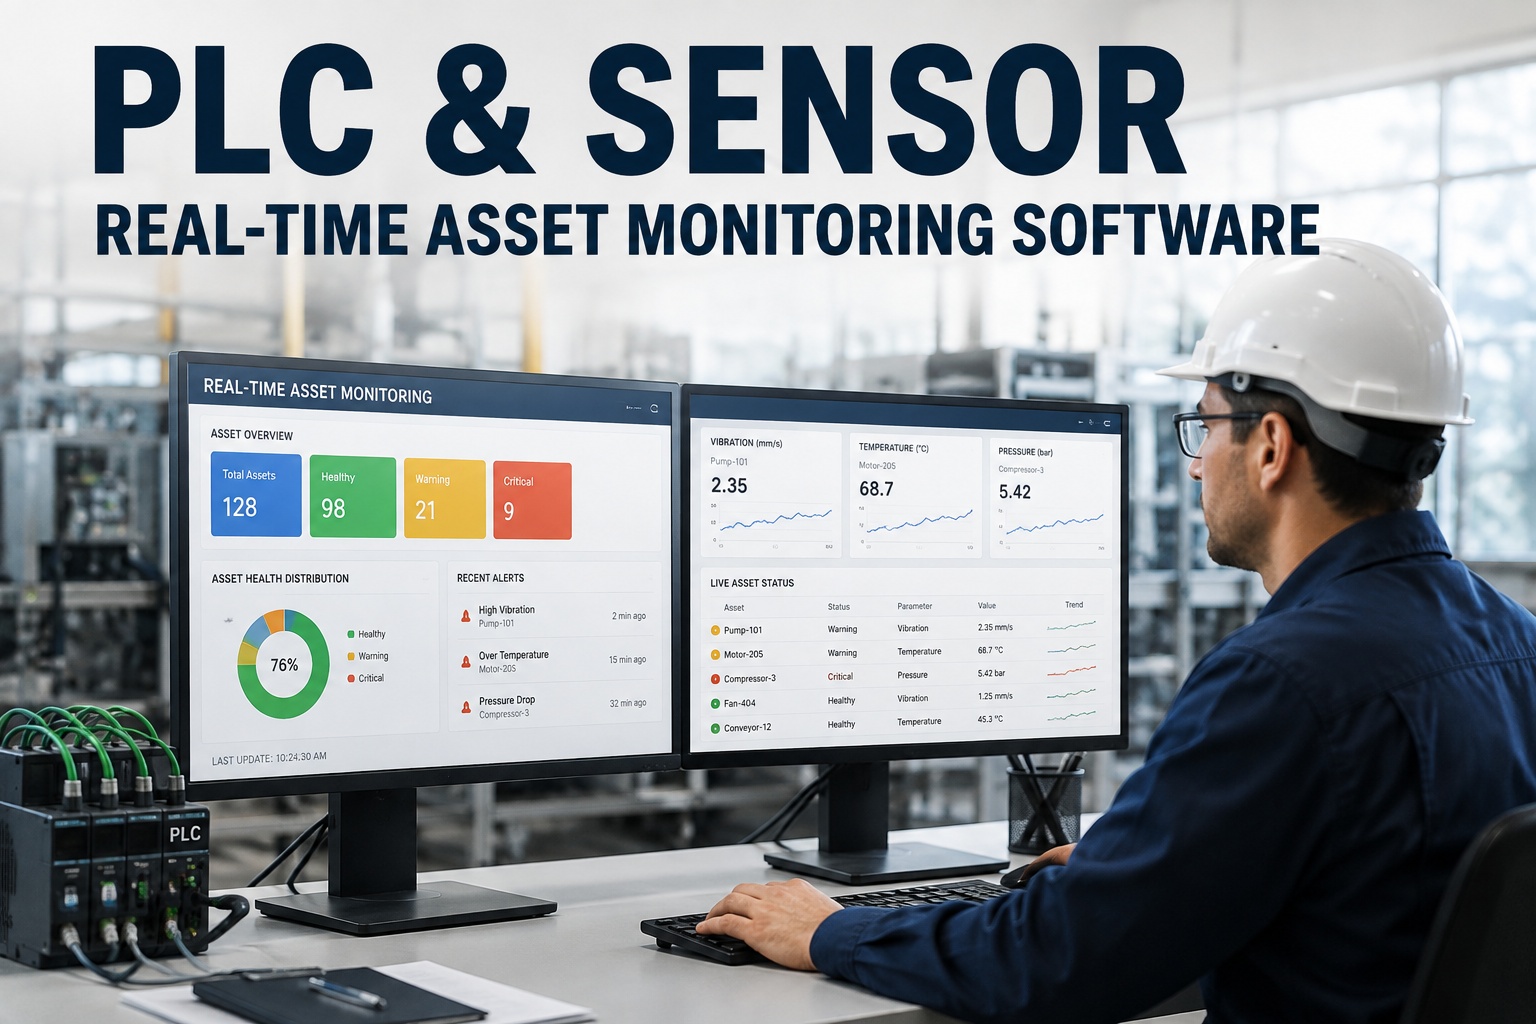
PLC & Sensor Real-Time Asset Monitoring Software

By Riley Quinn on September 2, 2026

plc-sensor-real-time-asset-monitoring

A PLC on the shop floor knows things nobody in the maintenance office can see. It knows motor current is trending up. It knows discharge pressure has drifted 4% since Tuesday. It knows vibration on bearing #3 crossed the amber threshold at 2:14am. All of it sits inside the PLC as tagged data — worthless unless something acts on it. The gap between "the PLC knows" and "a technician has been dispatched" is where predictive maintenance either works or fails. Book a 30-minute demo to see live PLC-to-CMMS data flow.

The PLC-to-CMMS Data Pipeline
Four Layers · From Field Signal to Scheduled Work Order
Integration is not a single switch — it is a four-layer architecture that moves equipment data from PLC register to maintenance action in milliseconds
Layer 4
Oxmaint CMMS
Subscribes to tags · applies thresholds · creates classified work orders · scores asset condition · triggers PM cycles
Work orders
PM triggers
Condition scoring
Anomaly detection
Latency · under 60s from signal to work order
Layer 3
IoT gateway + broker
Exposes tag values as industry-standard messages · handles protocol translation · manages security + authentication
OPC-UA
MQTT
REST API
Edge inference
Latency · sub-second event delivery
Layer 2
SCADA + historian
Aggregates raw signals into structured tag values with timestamps · applies engineering unit conversion · retains history for trending
Tag database
Historian
Alarm state
Trend logging
Latency · already running · CMMS listens to it
Layer 1
Field · PLCs + sensors
Generate raw process data · motor current, vibration amplitude, pressure, temperature, cycle count, alarm state
Siemens
Allen-Bradley
Mitsubishi
Schneider
Latency · milliseconds native · sampled continuously

The Integration Reality: No Replacement Required

The single biggest myth about PLC-to-CMMS integration is that it requires ripping out existing controllers or replacing operational technology. It does not. Modern OPC-UA and MQTT protocols connect to virtually every industrial PLC installed since the 2000s. Legacy Modbus RTU controllers bridge through IoT gateways at £250-£1,000 hardware cost. Existing SCADA historians expose data through standard adapters. The integration listens to the existing stack — it does not replace it. Curious how Oxmaint connects to your specific controller fleet? Book a demo scoped to your PLC and SCADA environment.

Native
Modern PLCs · direct
Siemens S7 · Allen-Bradley ControlLogix · Mitsubishi Q · Omron NX · Schneider M580 · OPC-UA server built in · direct subscription
Bridged
Legacy PLCs · via gateway
Modbus RTU / Modbus TCP / OPC-DA controllers · IoT gateway £250-£1,000 · translates to MQTT or OPC-UA · no PLC firmware change
Historian
SCADA + historian feeds
Existing OSIsoft PI, AVEVA, Wonderware, Ignition historians polled through standard REST or OPC-UA adapters · zero PLC touch
Wireless
Retrofit IIoT sensors
Where no PLC exists · vibration + temp wireless sensors on WirelessHART, ISA100, LoRaWAN · gateway to Oxmaint

The Sensor-to-Failure-Mode Map

Effective PLC monitoring is not about collecting every possible signal. It is about collecting the right signals for the failure modes that matter. Vibration data for bearing wear. Current draw for motor winding degradation and mechanical binding. Discharge pressure for fluid system integrity. Temperature for insulation breakdown and cooling loss. Each signal maps to a specific failure mode, and the CMMS applies a specific threshold logic to each. Teams new to failure-mode-driven sensor design can sign up free to explore the sensor mapping workspace.

Common Sensor Signals + Their Failure-Mode Coverage
Vibration · RMS + g-force
mm/s · g
Bearing wear · rotor imbalance · misalignment · looseness
Motor current
Amps
Winding degradation · mechanical binding · load anomaly · efficiency loss
Temperature
°C
Insulation breakdown · lubrication loss · cooling channel restriction
Pressure differential
PSI · bar
Filter clogging · valve seat wear · pump degradation · leaks
Flow rate
L/min · gpm
Pump wear · impeller erosion · line blockage · cavitation onset
Acoustic · ultrasonic
dB · kHz
Compressed air leaks · steam trap failure · early bearing defects

The Alert-Fatigue Problem — and the Two-Threshold Fix

The single most common failure mode of PLC monitoring programmes is not the sensors, the protocols, or the gateways. It is alert fatigue — a stream of low-value notifications so noisy that operators stop reading them, and the one real fault gets missed in the flood. The fix is a two-level threshold with a time-hold: warning at amber for inspection, critical at red for immediate response, and a 60-120 second time-hold before either fires. This eliminates transient spikes without missing sustained excursions. Want to see the alert configuration workflow live? Book a demo of the threshold and alert configuration workspace.

Normal
Signal within envelope · no action · trended silently against baseline
Warning · amber
Threshold 1 crossed for 60-120 seconds · inspection work order raised · non-urgent
Critical · red
Threshold 2 crossed for 60-120 seconds · immediate response · technician paged
The 60-second rule
Momentary spikes filtered out · sustained excursions promoted to work orders · signal-to-noise ratio protected
See Real PLC Data Flowing Into a Live Workspace
Watch a 30-minute demo of Oxmaint ingesting live PLC and sensor data, converting threshold breaches into work orders, and tracking asset condition in real time — with your own protocol stack in scope.

Real-Time Impact: What Sub-Minute Response Actually Delivers

The measurable outcome of connected PLC monitoring is not "we can see charts". It is fault response time collapsing from 45 minutes to under 8 minutes. It is the sensor-to-work-order journey completing in under 60 seconds instead of waiting for someone to notice on a HMI screen. It is condition-scored asset records replacing tribal knowledge about which pump is "the one that always fails first". The financial impact compounds because faster response equals shorter downtime equals more productive hours per shift. Want to see the impact numbers modelled against your plant baseline? Book a demo of the impact modelling workspace.

45 → 8 min
Fault response time
From HMI observation to technician dispatch · classified work order with fault data attached · under 8 minutes typical
under 60s
Sensor-to-work-order
Threshold breach to structured work order · assigned technician · fault code + asset record linked · asset history logged
under 2 hrs
First sensor live
Standard protocol first-sensor connection · alert rule configured · first live signal streaming to CMMS
6 weeks
Full deployment
Critical asset sensor coverage complete · alert rules refined · condition dashboards operational · predictive workflows active

Beyond Alerts: Runtime Hours as PM Triggers

Alert-driven work is only half of what PLC data delivers. The other half is meter-based preventive maintenance — using PLC runtime hours, cycle counts, batch counts, energy consumption or lubrication cycles as the trigger for scheduled PM instead of the calendar. A pump that runs 40 hours in a week gets its 500-hour bearing check when it hits 500 hours — not when it hits an arbitrary month boundary. A press that runs 8,000 cycles a day gets its die inspection when it hits 25,000 cycles — not on a Tuesday because Tuesday is inspection day. This eliminates the calendar-PM waste on quiet assets and the calendar-PM miss on busy ones. Curious how meter-based PM configures against your PLC estate? Book a demo of the meter-based PM workspace.

PLC runtime tag
→ Hours-based PM
Motor at 500 / 1,000 / 2,500 hour intervals · pump service at 4,000 hours · rebuild at 20,000
PLC cycle counter
→ Cycle-based PM
Press at cycle bands · die inspection windows · tool life triggers · injection mould shot count
Batch count tag
→ Batch-based PM
Mixer rotor check at batch band · CIP verification cadence · vessel inspection triggers
Energy meter
→ Consumption-based PM
Compressor efficiency check at kWh threshold · HVAC service at energy consumption band

Expert Perspective: The Data Is Already There

The most persistent misconception about PLC monitoring is that it requires a new sensor programme. In almost every industrial plant I have worked with, the sensors are already installed, the PLCs are already logging values, and the SCADA system is already displaying trend lines that nobody outside the control room ever sees. The gap is not sensing — it is routing. The vibration data that would have flagged the bearing failure three weeks in advance was already in the PLC tag database. It just was not connected to the maintenance system that could have raised the work order. When the CMMS subscribes directly to those tags, applies structured threshold logic and creates work orders automatically, the transformation happens without any new hardware. The data was already there. It was waiting for something to listen.

Curious how much of your existing PLC and SCADA data could be flowing into structured maintenance action tomorrow? Book a demo scoped to your controller estate.

Deployment Anatomy: What a Realistic Six-Week Rollout Looks Like

A PLC-to-CMMS rollout should follow the criticality of the assets, not the availability of the sensors. Start with the two or three assets whose failure costs the most — highest downtime impact, longest lead time on parts. Get sensor-to-work-order working there before scaling. Teams planning phased deployment can book a demo and we will scope the rollout against your critical asset list.


Weeks 1–2
Critical asset + protocol map
Top 5 critical assets identified
Existing PLC + SCADA inventory
Protocol path per asset agreed
First-signal test connected
Weeks 3–4
Thresholds + alert workflow
Two-level thresholds per signal
60-120s time-hold applied
Work order routing configured
On-call escalation path live
Weeks 5–6
Dashboard + scale-out
Asset condition dashboards live
PM triggers on runtime hours
Sensors added for tier-2 assets
Alert-fatigue tuning cycle

Frequently Asked Questions

What industrial protocols does Oxmaint support?
Oxmaint supports OPC-UA, MQTT, Modbus TCP, Modbus RTU (via gateway), REST API and HART natively. Additional protocols including PROFINET, WirelessHART, ISA100 and LoRaWAN connect through standard IoT gateways. Existing SCADA historian systems (OSIsoft PI, AVEVA, Wonderware, Ignition) integrate through their published REST or OPC-UA endpoints. In practice, virtually every industrial PLC or sensor installed in the last 20 years can be connected without replacement — the integration listens to the existing stack rather than requiring a new one.
Do we need to replace our existing PLCs?
No. Modern PLCs (Siemens S7, Allen-Bradley ControlLogix, Mitsubishi Q, Omron NX, Schneider M580 and equivalent) connect directly through their built-in OPC-UA servers. Legacy Modbus RTU or OPC-DA controllers bridge through an industrial IoT gateway costing £250-£1,000 that translates the older protocol into MQTT or OPC-UA. The PLC firmware is untouched, the control logic is unchanged, and the operational technology stack remains under its existing governance. Oxmaint sits alongside the existing SCADA — it does not replace it.
How do you prevent alert fatigue from too many sensor notifications?
Alert fatigue is the number-one failure mode of PLC monitoring programmes, and Oxmaint applies structured defences against it. Every signal gets a two-level threshold — amber warning for inspection and red critical for immediate response. A 60-120 second time-hold is applied before either level fires, eliminating momentary spikes that would otherwise flood the alert stream. Threshold values are tunable per signal, per asset and per shift pattern. Weekly alert-tuning cycles refine thresholds based on real operational data. The measurable outcome is signal-to-noise ratio protected as coverage scales.
How quickly can we go from first sensor to first work order?
For standard protocols on modern PLCs, first sensor connected and first alert rule configured typically completes in under 2 hours. The end-to-end sensor-to-work-order journey — signal crossing threshold, time-hold clearing, classified work order created with fault data attached and technician assigned — runs in under 60 seconds. A full deployment covering critical assets across a mid-sized plant typically reaches operational condition monitoring within 6 weeks. Fault response time drops from a typical 45 minutes on visual HMI observation to under 8 minutes on connected workflow.
Do PLC signals work in facilities without strong network coverage?
Yes. Edge gateways buffer signals locally when cloud connectivity drops, forwarding queued data on reconnection with timestamps preserved. Wireless sensor options include LoRaWAN (up to 10km range with no existing Wi-Fi required) and cellular 4G/5G (works anywhere with mobile coverage). Dual-link redundancy — industrial Ethernet primary plus cellular backup — supports under-500ms failover for critical assets. This means condition monitoring works reliably in remote sub-stations, outdoor plant areas, or brownfield sites without infrastructure upgrade.
Turn Existing PLC Data Into Structured Maintenance Action
Let Oxmaint show you how OPC-UA, MQTT and Modbus feeds turn into classified work orders, condition-scored asset records and predictive triggers — with your own controller estate in scope.

Share This Story, Choose Your Platform!





