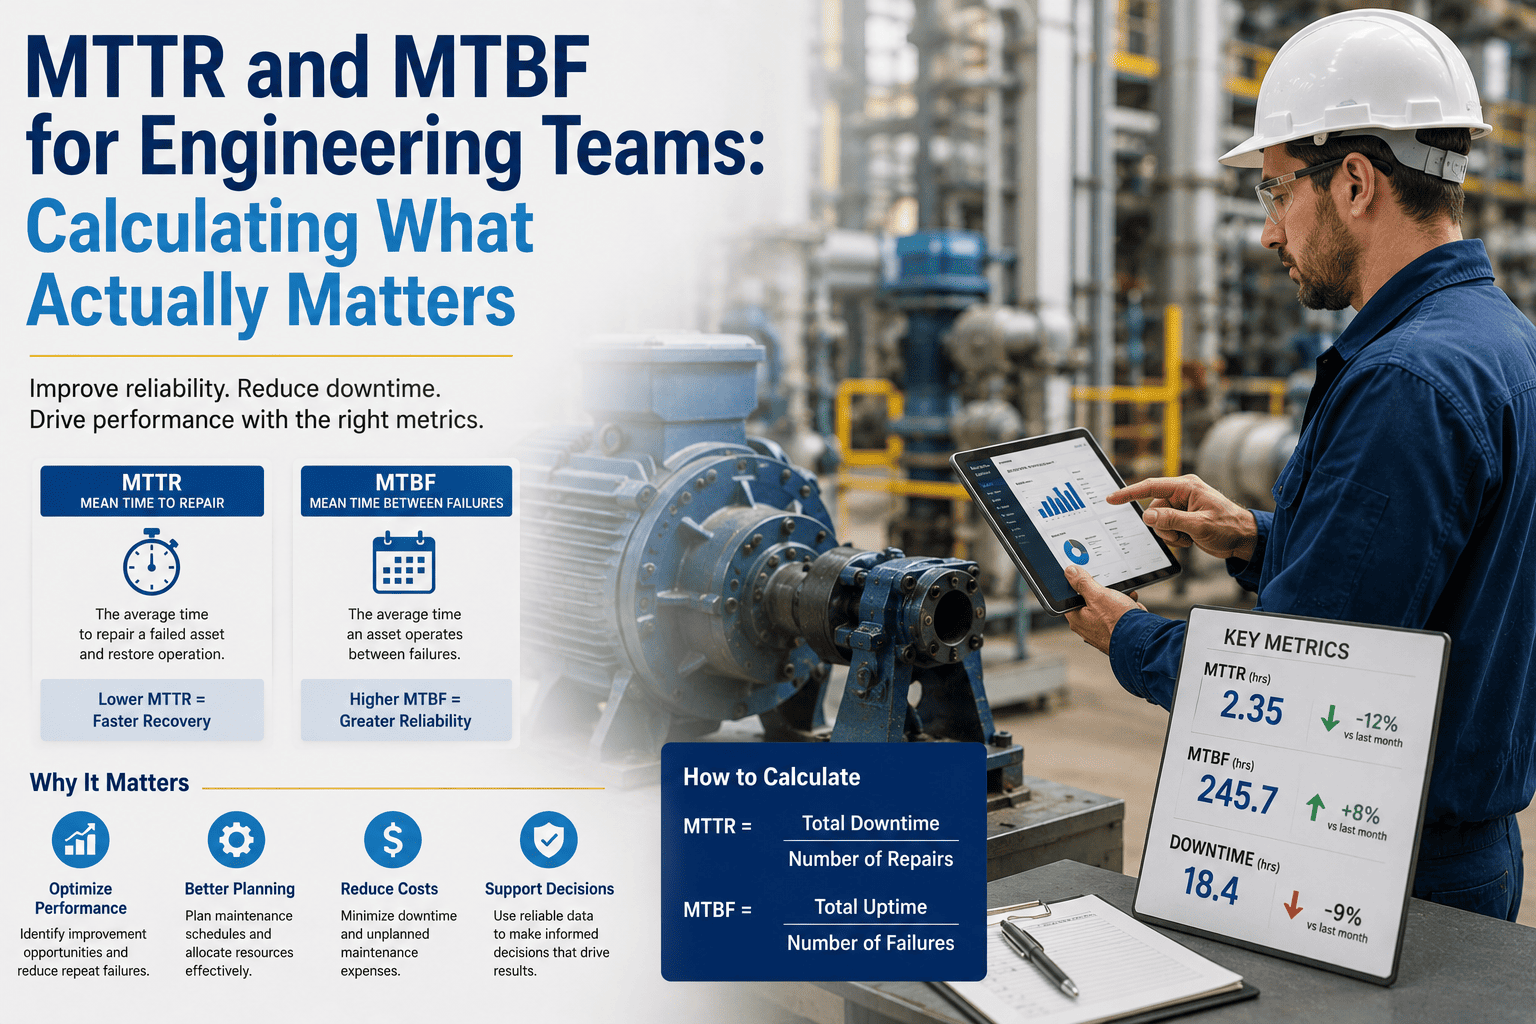
MTTR and MTBF are two of the most widely used reliability metrics for engineering and maintenance teams, yet they are often misunderstood or measured incorrectly. While MTTR focuses on how quickly equipment can be restored after a failure, MTBF evaluates the average operating time between failures. Together, these metrics provide valuable insights into asset reliability, maintenance effectiveness, and operational availability. Understanding how to calculate, interpret, and improve MTTR and MTBF helps organizations make better maintenance decisions, reduce downtime, and optimize resource allocation. This guide explains the formulas, common pitfalls, practical benchmarks, and proven strategies engineers can use to track the metrics that truly matter.
Track MTTR and MTBF Automatically — No Spreadsheets
OxMaint calculates both metrics continuously from work order data, trends them over time, and flags degrading assets before they fail.
What MTTR and MTBF Actually Measure
These two metrics cover opposite ends of the reliability equation. MTBF tells you how often assets fail. MTTR tells you how fast your team recovers when they do. Neither number alone gives the full picture — you need both to understand true equipment availability.
MTBF = 230 hours
MTTR = 3 hours
Together they calculate the number every operations director actually cares about — Availability = MTBF ÷ (MTBF + MTTR). A pump with MTBF 230 hours and MTTR 3 hours runs at 98.7% availability. Shave 60 hours off MTBF and you drop to 97.4% — roughly 110 fewer production hours per year on that single asset.
The Four Phases of MTTR Most Teams Miss
The biggest mistake in MTTR tracking is measuring only the wrench time. True elapsed repair time has four distinct phases, and the first two often account for the majority of total downtime:
Reporting total MTTR without phase breakdown hides where the time actually goes. If detect and diagnose account for 70% of your downtime, no amount of technician training on wrench speed will move the number.
Industry Benchmarks at a Glance
| Industry | World-Class MTBF Target | MTTR Red Flag | Primary Focus |
|---|---|---|---|
| Manufacturing (General) | 400+ hours per critical asset | Above 4 hours | Both equally weighted |
| Automotive Assembly | 500+ hours per line | Above 2 hours | MTTR — line stoppages are catastrophic |
| Food and Beverage | 300+ hours | Above 3 hours | MTBF — hygiene shutdowns cost more |
| Data Centers | 8,700+ hours (99.99% uptime) | Above 30 minutes | MTBF — failure prevention primary |
| Aviation MRO | Regulated per component | Varies by criticality | MTBF — safety regulations drive it |
MTTR above 4 hours on critical manufacturing assets is a red flag in most sectors. Sign up free to see OxMaint benchmark your assets automatically against these thresholds.
Six Mistakes That Corrupt Your Numbers
How to Move Each Metric in the Right Direction
Improving MTBF and reducing MTTR require different levers. Conflating them leads to programs that look busy but move neither number.
- Increase PM completion rate above 90% — compliance drop predicts MTBF decline within 60-90 days
- Use failure reason codes to identify the top three recurring failure modes per asset class
- Stock critical spares based on MTBF patterns — if a bearing averages 300 hours, stock it at hour 270
- Trend MTBF monthly per asset; a 15% quarter-over-quarter decline warrants a condition assessment
- Capture failure timestamps the moment a work order opens — not at shift end
- Enforce shift handover notes: asset ID, failure description, current repair status
- Separate detect-and-diagnose time from wrench time to find where delays actually live
- Pre-position parts for high-MTTR assets — parts wait time is the most common hidden driver
The Availability Equation in Practice
That 1.9 percentage point gain represents roughly 167 additional production hours per year on a single asset running two shifts. On a line of ten critical assets, the number becomes impossible to ignore. Book a demo to see how OxMaint calculates availability impact across your entire asset register automatically.
What a CMMS Does That Spreadsheets Cannot
Stop Calculating MTTR and MTBF by Hand
OxMaint tracks both metrics automatically from work order timestamps, trends them per asset, and surfaces degradation before it becomes downtime. Sign up free or book a demo — no spreadsheet formulas required.
Frequently Asked Questions
What is the difference between MTTR and MTBF?
MTBF measures how long an asset runs between failures — a reliability metric that tells you whether your maintenance strategy is working. MTTR measures how fast your team restores the asset after a failure — a maintainability metric that reflects response process and parts availability. High MTBF means fewer unplanned stops. Low MTTR means faster recovery when stops happen. You need to track both.
Should planned maintenance downtime be included in MTBF?
No. MTBF counts unplanned failure events only. Planned maintenance shutdowns are not failures — including them collapses your MTBF figure and makes a well-maintained asset look unreliable. Operating time used in the MTBF calculation should also exclude planned downtime periods.
What is a good MTTR target for manufacturing?
MTTR above 4 hours on critical manufacturing assets is considered a red flag across most sectors. Top-quartile manufacturers achieve MTTR significantly below the industry average, which translates to hundreds of additional production hours per asset per year. The right target depends on asset criticality and industry — automotive assembly lines typically target under 2 hours.
Why does my MTBF keep declining even though PM completion is high?
High PM completion with declining MTBF usually indicates one of three problems: PMs are being completed on time but not to the correct standard; the PM interval is wrong for actual operating conditions; or a design or installation fault is causing recurring failure regardless of maintenance. Failure reason codes captured at each repair event are the fastest way to identify which applies.
How does a CMMS improve MTTR and MTBF accuracy?
A CMMS captures work order timestamps automatically at the moment events happen, eliminating end-of-shift recall bias that regularly distorts manually logged data. It also tracks both metrics per individual asset over time, making degradation trends visible before they show up in lagging production reports.