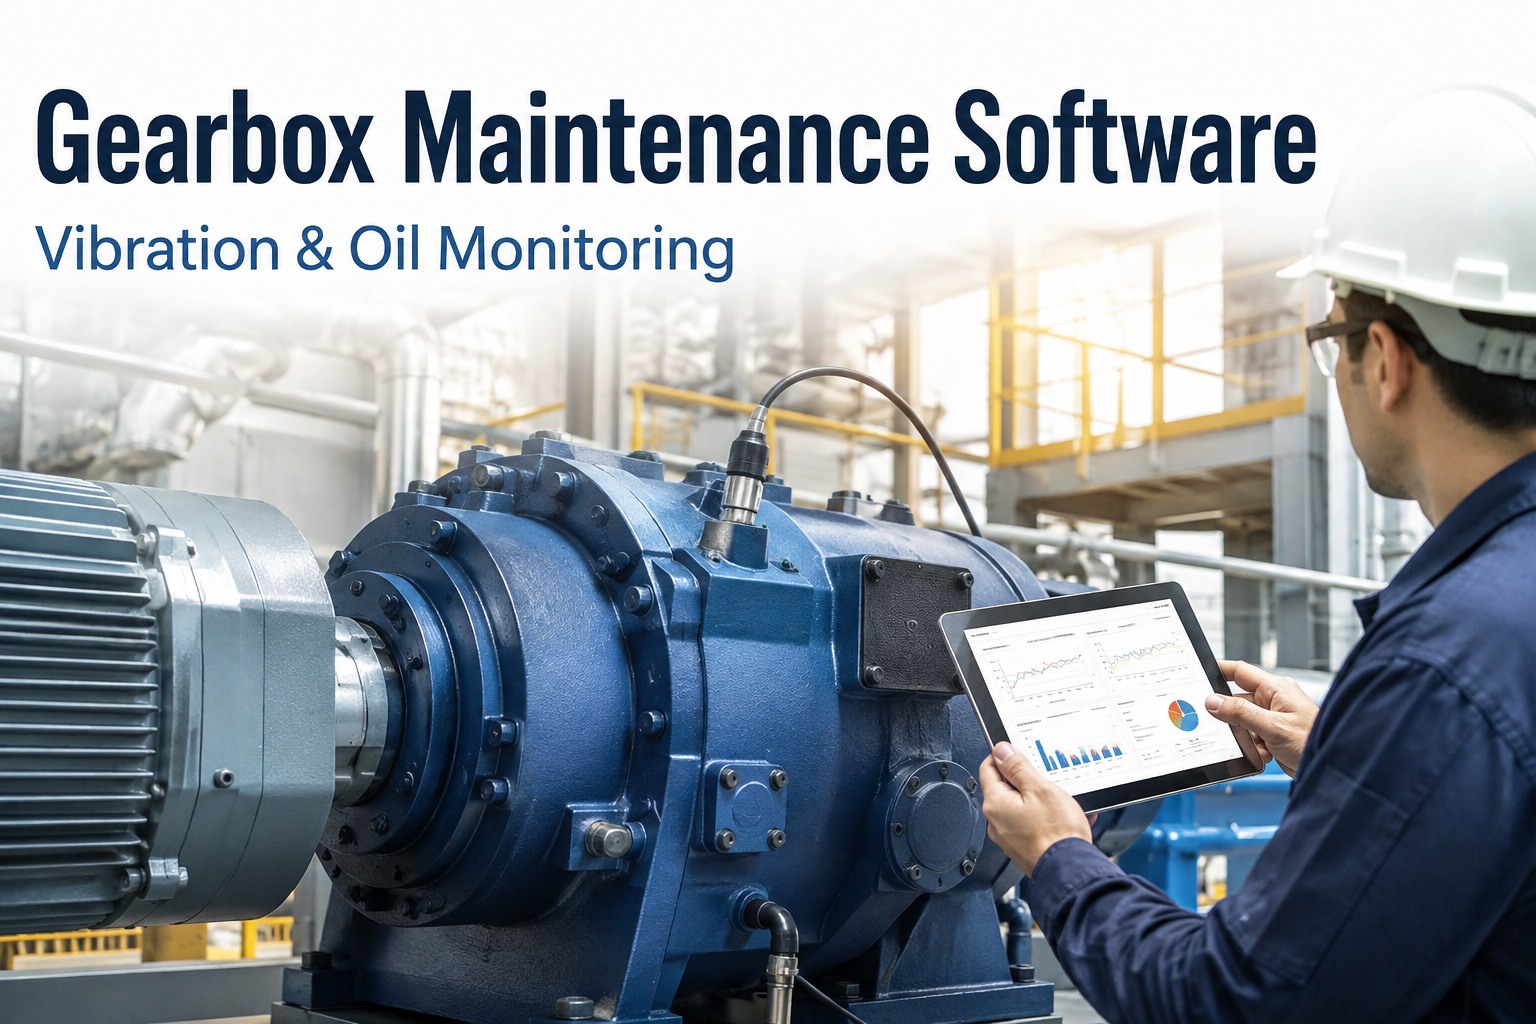
A gearbox rarely fails without warning. It broadcasts its impending failure through vibration frequencies, oil chemistry drift and temperature signatures for weeks — sometimes months — before catastrophic breakdown. Yet across UK industry, gearboxes fail unexpectedly every day because the warning signals go into folders no one reads, or into reports that never translate into work orders. A properly configured gearbox maintenance system doesn't need cleverer sensors; it needs the discipline to route every anomaly into a tracked corrective action before it becomes wreckage. Book a demo to see gearbox reliability workflows in action.
◆ GEARBOX RELIABILITY · CBM · P-F INTERVAL
Every gearbox tells you it's going to fail. The question is whether anyone is listening — and whether the warning becomes work before it becomes wreckage.
Every mesh frequency, every wear-metal ppm, every temperature drift — under one condition-driven maintenance system.
VIBRATION SIGNATURE · GEAR MESH FREQUENCY BAND
Frequency (Hz)Amplitude
6-12wks
P-F interval for typical gearbox faults
£85k
Typical failed vs planned intervention delta
30×
Cost multiplier · Unplanned vs planned rebuild
Reading the Vibration Signature — What the Spectrum Actually Tells You
Vibration analysis is the most powerful gearbox diagnostic technique available, and the least understood by teams new to condition monitoring. Every gear fault has a characteristic frequency signature — gear mesh frequency (GMF) elevation for tooth wear, sidebands around GMF for eccentricity or misalignment, 1× shaft frequency for imbalance, high-frequency envelope acceleration for bearing defects. The signatures are unambiguous once you know what you're reading. Sign up free to route vibration anomalies straight into work orders.
FAULT SIGNATURE DIAGNOSTIC
Frequency Reading → Root Cause → Action
1×
Shaft-speed peak (1× RPM)
Cause · Imbalance · Bent shaft · Coupling misalignment
Vibration tells you something is failing. Oil analysis tells you what and how fast. Wear-metal spectroscopy identifies which internal component is shedding material — iron for gears, copper for bushings, chrome for bearing races, silicon for contamination ingress. Read together, vibration,and oil analysis triangulate the failure mode with high confidence, weeks before mechanical inspection would ever catch it. Sign up free to ingest oil analysis lab results per gearbox.
Contamination ingress · Breather / seal failure — fix source, not symptom
H₂O
Water Content
Condensation · Cooler leak
Alert · > 0.1 %
Water destroys oil film · Accelerates every wear mechanism simultaneously
Vis
Viscosity Drift
Oxidation · Contamination · Shear
Alert · ±10 % of new
Oil losing its ability to protect · Change decision trigger
A single sample tells you the current state. A trend across four samples tells you the failure mechanism and roughly how long until intervention becomes essential — the diagnostic value is in the trend, not the reading.
The P-F Curve — Where CBM Actually Pays
Every mechanical failure follows the same curve: a Potential failure point (P) where the first detectable warning appears, and a Functional failure point (F) where the machine stops working. The interval between P and F is what determines whether you get to intervene with a planned maintenance action or a 3 a.m. reactive one. Condition monitoring's entire economic value is in extending the P-F interval — catching the failure earlier, at lower cost, with less production impact. Book a demo to see the P-F workflow in a live UK deployment.
P-F INTERVAL · GEARBOX FAILURE EVOLUTION
Detection Technique vs Time-to-Failure
P₁
Oil Analysis
6-9 months
Trace wear metals first appear · Silent stage · Cheapest possible intervention
Machine down · Full rebuild or replacement · Production lost
Cost of intervention rises exponentially from left to right. Oil analysis at P₁ typically resolves for £2-5k in planned work. The same gearbox reaching F unattended commonly costs £60-100k in emergency repair, replacement and lost production combined.
◆ GEARBOX RELIABILITY DEMO
See the Full Condition Workflow in 30 Minutes
Gearbox asset hierarchies, vibration and oil analysis integration, P-F interval visualisation per machine, condition-driven work orders, thermographic route capture and MTBF trending across gearbox populations.
Where Gearboxes Live — Industry-Specific Reliability Challenges
A wind turbine main gearbox has almost nothing in common operationally with a paper machine drive train, and both are worlds apart from a conveyor drive. Each industry stresses gearboxes differently and needs a differently tuned reliability programme. What follows is what a working CMMS actually holds per application context.
Cycle-loading · Vibration exposure · Diverse population · Consumable culture
Focus · Population MTBF · Standardised PPM · Spares strategy
Expert Perspective — Why Gearbox Reliability Is Actually a Data Problem
"
The most consistent finding across gearbox reliability audits is not that sites lack condition monitoring — it's that the condition monitoring data doesn't reach the maintenance workflow. A vibration report gets emailed to the reliability engineer, who forwards it to the maintenance planner, who intends to raise a work order but gets distracted by a breakdown, and by the time they come back to it three weeks later the gearbox has already gone. Or an oil sample comes back with rising iron ppm and the report sits in a folder because nobody has structural responsibility for reviewing the lab output against a threshold. What a properly configured CMMS solves is not the analytics — the analytics are already good enough on most sites. It's the routing. Every vibration alert becomes a work order. Every oil report result attaches to the asset with threshold-triggered actions. Every thermographic exceedance generates a tracked task. This is the boring structural work that turns condition monitoring from expensive theatre into genuine reliability improvement — and it's almost entirely a workflow-and-integration problem, not a sensor problem.
— Rotating Equipment & Reliability Engineering Practice
01
Gearbox hierarchy per asset
Every gearbox holds bearings, gears, shafts, oil charge and cooling as tracked sub-components with individual histories.
02
Vibration → work order
Every threshold exceedance auto-generates a routed work order with priority, target date and evidence capture.
03
Oil analysis structural
Lab results ingest per gearbox with wear-metal trending. Anomalies escalate to inspection work orders automatically.
04
P-F interval visible
Each detection method tagged with its P-F horizon. Planning window becomes explicit rather than assumed.
Who Uses Oxmaint for Gearbox Reliability in the UK
The platform is used by the UK roles that own gearbox reliability day-to-day: reliability engineers driving population MTBF across manufacturing sites, wind farm operations engineers responsible for main gearbox condition monitoring, paper mill and steel plant engineers running continuous-duty drive assemblies, conveyor and bulk-handling engineers with drive-gearbox fleets, food and beverage engineers managing processing-line gearboxes, cement and quarry engineers overseeing kiln and mill drive units, and rotating equipment specialists at industrial services companies who provide gearbox inspection and rebuild as a service to end-users. Sign up free to configure gearbox reliability for your fleet.
Getting Gearbox Reliability Live in 30-45 Days
Deployment starts with the gearbox asset register — every unit with make/model/service factor, oil charge, service history and criticality tier. PPM templates configure per criticality. Vibration route or continuous monitoring integration for prioritised gearboxes. Oil analysis programme structural with sample scheduling and lab data ingestion. Thermography route templates deploy. Work order routing rules configure so vibration exceedances, oil metal thresholds and thermal alerts auto-generate tracked actions. MTBF trending baseline per gearbox population. Most industrial sites see gearbox register, PPM cycles and condition-data routing live within 30-45 days; continuous vibration integration typically follows as sensor deployment progresses across the fleet.
◆ FROM DATA-IN-A-FOLDER TO WORK-IN-PROGRESS
Every Gearbox. Every Signal. Every Action.
Oxmaint gives UK plant operators the full gearbox reliability cycle in one platform — hierarchies with sub-components, vibration and oil analysis integration, P-F interval-aware planning and condition-driven work order routing.
Gearbox maintenance software is a CMMS configured specifically for gearbox reliability across industrial, wind, paper, steel, conveyor and processing applications. It holds each gearbox as a parent asset with sub-component hierarchies (input shaft, output shaft, gears, bearings, oil charge, cooling system), integrates with vibration monitoring (route-based or continuous), ingests oil analysis laboratory results with wear-metal trending per element, tracks thermography scan data, holds P-F interval per detection method so planning windows are explicit rather than assumed, auto-routes condition data anomalies into tracked work orders, and produces MTBF and availability reporting per gearbox population.
How does vibration monitoring integrate with the platform?
Vibration integration is layered per criticality. Wind turbine main gearboxes and other Tier-A critical machines typically get online continuous monitoring with sensor telemetry (SKF, Emerson AMS, GE Bently Nevada or similar) feeding into the CMMS; anomaly detection against learned normal envelopes generates work orders when RMS velocity, envelope acceleration or specific frequency amplitudes (1× RPM, GMF, BPFI, BPFO) exceed thresholds. Tier-B machines get route-based data collection on monthly cycles with portable analyser data uploaded and trended per bearing position. The pattern is consistent — vibration signal anomaly becomes tracked work order with priority, owner and target closure rather than sitting in an analyst's spreadsheet.
Does it handle oil analysis lab results?
Yes. Oil analysis programmes deploy with sample scheduling per gearbox on cycle appropriate to criticality (quarterly for Tier A, 6-monthly for Tier B). Lab results ingest against the asset record — wear metals (iron, copper, chromium, tin, lead, aluminium), contamination (silicon, water content, particle count), and oil health parameters (viscosity, TAN acid number, TBN base number, oxidation, additive depletion). Trending across four or more samples reveals the failure signature; a single sample tells you the current state, but the diagnostic value is in the trend. Threshold-based alerts auto-generate inspection work orders when parameters exceed limits, and results become part of the persistent gearbox history for lifecycle decisions.
What is the P-F interval and why does it matter?
The P-F interval is the time between the first detectable warning of an impending failure (P — Potential failure) and the failure itself (F — Functional failure). For gearbox faults, oil analysis typically detects the earliest P at 6-9 months from failure, vibration analysis at 2-6 months, thermography at 2-8 weeks, and audible/visible symptoms at days to hours. The economic value of condition monitoring is entirely in the P-F interval — catching the fault earlier means planned intervention at lower cost with less production disruption. A CMMS that tags detection methods with their P-F horizon per fault type makes intervention planning explicit rather than reactive, and turns the theoretical value of CBM into structural workflow.
How long does deployment typically take on a UK gearbox population?
A single site with 20-100 gearboxes typically goes live within 30-45 days — gearbox asset register import with criticality tiering, PPM template configuration per tier and application type, oil analysis programme structural with lab result ingestion route, vibration data upload integration for portable analysers or continuous monitoring where deployed, thermography route templates, and work-order routing rules that turn threshold exceedances into tracked actions. Multi-site industrial deployments and wind farm fleet rollouts typically complete within a quarter to six months. Continuous vibration integration timing depends on sensor deployment progress across the fleet — many sites start with route-based collection and add continuous monitoring on Tier-A machines in phased rollout.