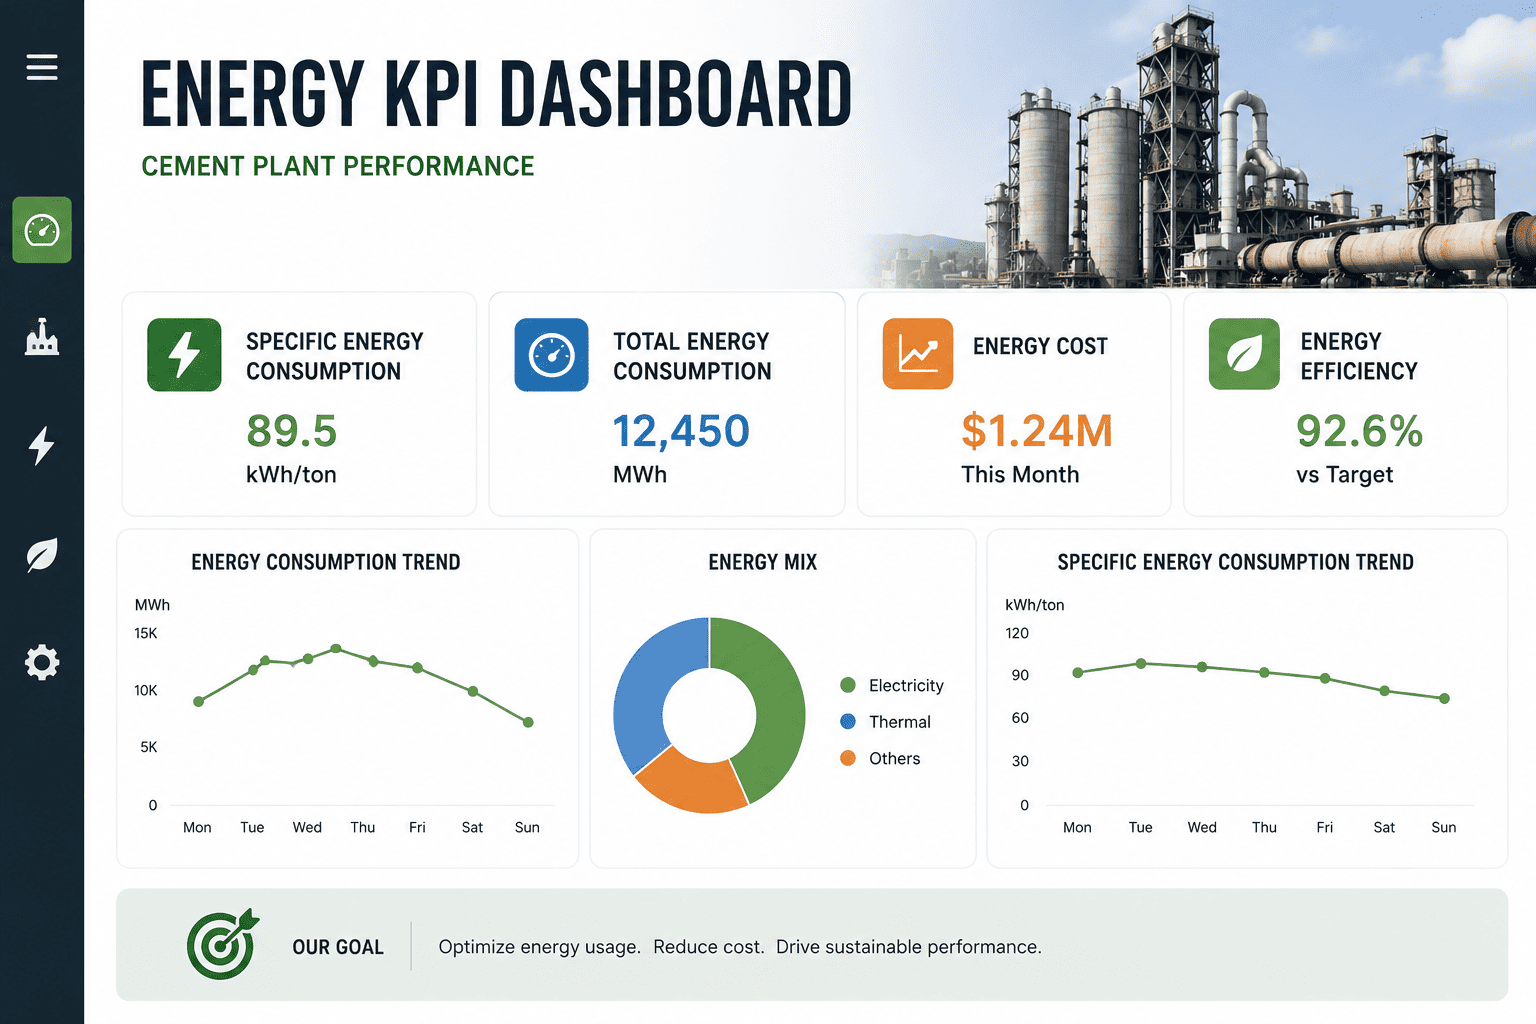
Energy is usually the second-biggest line item on a cement plant's cost sheet, right behind raw materials, and it drifts quietly. A mill running 15% over its design kWh per tonne doesn't trip an alarm, it just shows up months later as a bigger power bill nobody can fully explain. This energy KPI dashboard template gives cement plants a single view of SEC, power consumption, fuel and AFR rate, clinker factor, CO₂ emissions, and the maintenance metrics that actually drive them. Sign up to build your own energy dashboard inside your CMMS.
Why It Exists
Thermal and electrical energy together make up 60-70% of what it costs to produce a tonne of clinker. Most of that cost is set by equipment condition, not by the energy market, which means a dashboard that connects KPIs to the maintenance events behind them catches drift while it's still cheap to fix.
What The Dashboard Tracks
Specific Energy Consumption
kcal per kg clinker and kWh per tonne cement, tracked against your own historical best
Mill Power Draw
Raw mill, cement mill, and coal mill kWh per tonne tracked independently, not blended into one number
Fuel And AFR Rate
Share of thermal input coming from alternative fuels versus conventional coal or petcoke
Clinker Factor
Proportion of clinker in the final cement blend, the biggest single lever on both energy and CO₂
CO₂ Emissions Per Tonne
Combined process and combustion emissions, benchmarked against internal and sector targets
Maintenance KPIs
MTBF, MTTR, and equipment availability, since worn liners and misaligned drives are what push SEC up
Benchmark Targets By KPI
Specific Heat Consumption
700-750 kcal/kg
Specific Power Consumption
75-90 kWh/t
AFR Substitution Rate
40-80%
See Every KPI On One Screen
Oxmaint links your energy KPIs directly to the equipment, work orders, and technicians behind them, so a rising SEC number leads you to a root cause instead of a spreadsheet. Sign up for a free trial to build your dashboard, or book a demo to see it running on live plant data.
Turning A KPI Into An Action
KPI pulled directly from DCS, SCADA, and power metering, not entered by hand at shift end
Every subsystem, kiln, raw mill, cement mill, and cooler tracked against its own benchmark, not one blended plant average
Deviation from benchmark flagged the moment it crosses a threshold, not discovered at month-end review
Flagged KPI linked back to the specific asset, so a rising kWh/tonne points at a worn liner, not a mystery
Work order generated automatically from the flagged KPI, so the finding gets actioned, not filed away
Spreadsheet Tracking vs Live Dashboard
| Factor |
Spreadsheet |
Live Dashboard |
| Data source |
Manually entered at shift end, prone to gaps and typos |
Pulled automatically from DCS, SCADA, and power meters |
| Time to spot drift |
Weeks, once someone reviews the monthly report |
Minutes, as soon as the KPI crosses a threshold |
| Root cause visibility |
A number with no link to the asset behind it |
KPI linked directly to the equipment, work order, and technician |
| Action taken |
Depends on someone remembering to follow up |
Work order raised automatically from the flagged KPI |
The Takeaway
A single energy report tells you where you stood last month. A dashboard that ties SEC, fuel rate, clinker factor, and CO₂ back to live equipment condition tells you where you're heading, early enough to change it before it shows up on the cost sheet.
Frequently Asked Questions
Q
What is the difference between SEC and specific power consumption?
Specific energy consumption usually refers to the thermal energy used in the kiln system, measured in kcal per kg of clinker. Specific power consumption refers to electrical energy, measured in kWh per tonne of cement, and is driven mainly by grinding.
Q
Why does a rising kWh per tonne usually point to a maintenance issue?
Grinding accounts for around 40% of total plant electrical consumption, and mill power draw is set almost entirely by liner condition, media charge, and separator efficiency. A mill drifting above its design kWh per tonne is nearly always a maintenance signal, not an energy market one.
Q
Can this dashboard support ISO 50001 energy reporting?
Yes, tracking SEC, fuel mix, and CO₂ per tonne on a consistent, auditable schedule against documented benchmarks is exactly the evidence base ISO 50001 energy reviews expect.
Stop Finding Out About Energy Drift On The Cost Sheet
Oxmaint keeps every energy and maintenance KPI on one live dashboard, so drift gets caught while it's still cheap to fix. Sign up for a free trial to build your dashboard, or book a demo to see it running on your plant's numbers.