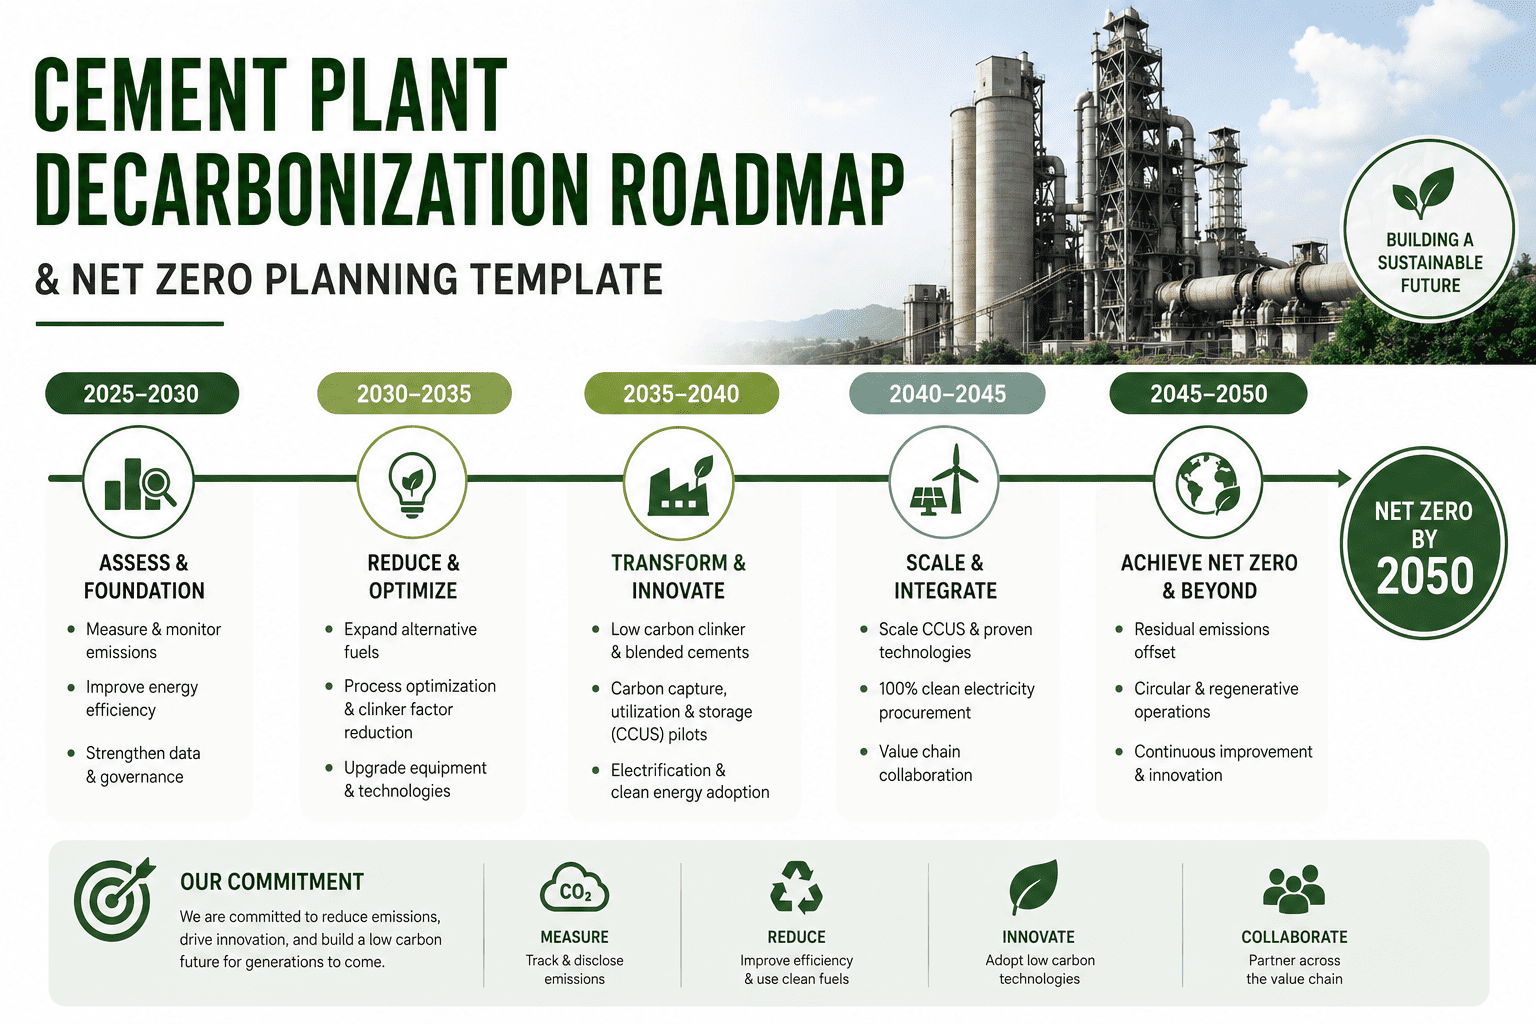
Cement is one of the hardest industries to decarbonize, and most of that difficulty isn't about switching fuels, it's about sequencing. Jump straight to carbon capture without fixing clinker factor and alternative fuel rate first, and a plant pays more for less reduction. This decarbonization roadmap template lays out the four proven pathways, a realistic phasing plan, and the ESG data points a plant needs to report against Net Zero targets. Sign up to build your own roadmap and emissions dashboard inside your CMMS.
Why It Exists
Around 60% of cement emissions come from the calcination chemistry itself, not from fuel, which means efficiency alone can only take a plant to roughly 40-50% reduction. A roadmap that sequences clinker substitution and alternative fuels first, then funds carbon capture with the savings, is the difference between a plan that works and one that stalls.
The Four Decarbonization Pathways
Clinker Substitution
Replacing carbon-intensive clinker with fly ash, slag, or calcined clay, lowering the clinker factor
Alternative Fuels
Waste-derived fuels and biomass displacing coal and petcoke in the kiln, raising the AFR rate
Energy Efficiency
Kiln optimization, heat recovery, and maintenance-driven fixes that cut SEC without new capital
CCUS
Carbon capture on process emissions, the only lever that closes the gap the other three can't reach
Roadmap By Phase
Phase 1: Efficiency And Maintenance Baseline
Year 1
Phase 2: Clinker Substitution Scale-Up
Year 1-2
Phase 3: Alternative Fuel Infrastructure
Year 2-4
Phase 4: CCUS Deployment
Year 4-10
Turn The Roadmap Into A Live Plan
Oxmaint tracks clinker factor, AFR rate, and SEC against your roadmap targets in one dashboard, so progress is visible instead of buried in an annual report. Sign up for a free trial to set up your roadmap, or book a demo to see it mapped to your plant.
What Belongs In Your ESG Report
CO₂ intensity per tonne of cement, tracked against your Science Based Target reduction pathway
Clinker factor trend, showing how much clinker-intensive material has been displaced year over year
Alternative fuel substitution rate, reported alongside the specific fuels and biomass share used
Energy efficiency gains from maintenance and process improvements, with the equipment record attached
CCUS project status and captured tonnage, once that phase of the roadmap is active
Sequencing By Cost Per Tonne Avoided
| Factor |
Low-Cost Levers |
High-Cost Levers |
| Examples |
Kiln efficiency, maintenance fixes, clinker substitution |
Alternative fuel infrastructure, CCUS plants |
| Capital required |
Minimal, often self-funding through cost savings |
Significant, typically multi-year capital projects |
| Emissions impact |
Moderate, gets a plant to roughly 40-50% reduction |
Large, closes the remaining gap to net-zero |
| Equipment dependency |
Depends on preheater seals and mill condition staying tight |
Depends on AF feed systems and capture equipment reliability |
The Takeaway
Net-zero cement isn't one project, it's four levers pulled in the right order. Start with the ones that pay for themselves, use those savings to fund the ones that don't, and track every phase against a live number instead of a static annual report.
Frequently Asked Questions
Q
Why can't efficiency and alternative fuels alone reach net-zero?
Roughly 60% of cement emissions come from the calcination chemistry that turns limestone into clinker, a process emission that fuel switching can't touch. Without carbon capture, the industry can reach about 40-50% reduction, not net-zero.
Q
What is LC3 cement and why does it matter for the roadmap?
LC3 replaces up to 50% of clinker with calcined clay and limestone, cutting CO₂ by up to 40% versus ordinary Portland cement while performing comparably. Clay is widely available and needs a much lower calcination temperature than clinker, making it a practical near-term lever.
Q
How does equipment maintenance affect the roadmap timeline?
Every lever on the roadmap depends on equipment that works. Leaking preheater seals erase efficiency gains, and poorly maintained AF feed systems limit how much alternative fuel a plant can actually burn, so maintenance reliability sets the ceiling on how fast the roadmap can move.
Build A Roadmap You Can Actually Track
Oxmaint connects clinker factor, AFR rate, SEC, and CO₂ per tonne to the equipment and maintenance work driving them, so your decarbonization plan stays live, not filed away. Sign up for a free trial to get started, or book a demo to see it mapped to your plant.