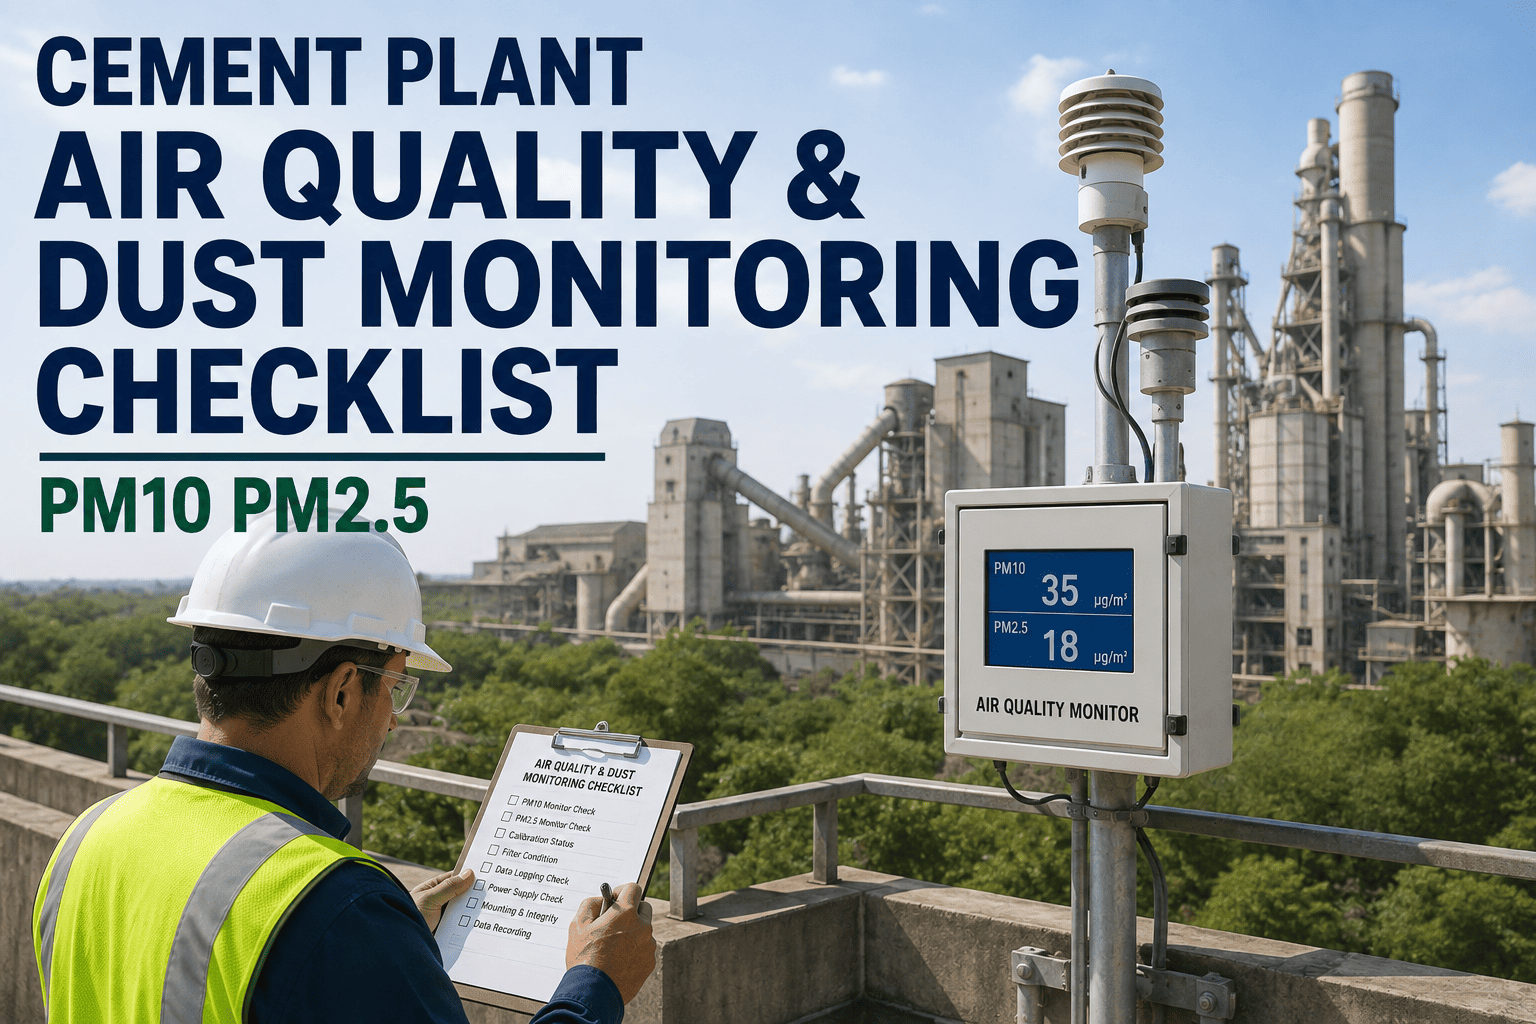
Cement plants generate dust at nearly every stage, raw material handling, kiln operation, clinker cooling, and finish grinding, and airborne particulate isn't just a housekeeping issue, it's a regulated exposure with real health consequences for workers and surrounding communities. PM10 and PM2.5 limits exist because fine particulate reaches deep into the lungs, and a monitoring program that only checks the stack misses fugitive dust from conveyors, silos, and haul roads. Sign up to log every reading against threshold and get flagged automatically before an exceedance becomes a violation.
Why It Matters
PM10 particles are small enough to enter the respiratory tract, while PM2.5 is small enough to reach the bloodstream. A cement plant's air quality program has to track both, at the stack and at the fenceline, because regulators and neighboring communities respond very differently to a documented exceedance than to a silent one caught early.
Where Dust Comes From And What To Watch
Kiln Stack
Highest volume source, continuous emissions monitoring typically required
Clinker Cooler
Fine particulate released during rapid cooling, filter condition critical
Finish Grinding
Respirable silica-bearing dust generated at the mill and separator
Material Transfer
Conveyors, chutes, and silo loading points, common fugitive dust sources
Haul Roads
Vehicle traffic on unpaved surfaces, a major fenceline PM10 contributor
Storage Piles
Wind erosion from uncovered raw material and clinker stockpiles
Building A Monitoring Routine That Holds Up
Calibrate samplers on schedule: PM10 and PM2.5 monitors verified against a reference standard before every campaign
Position samplers correctly: stack, fenceline, and nearest receptor locations covered, not just the easiest access point
Check bag filters and ESPs: pressure drop and opacity monitored daily, since a failing filter is the leading cause of exceedance
Log weather conditions: wind speed and direction recorded alongside every fugitive dust reading for context
Compare against threshold immediately: readings checked against permit limits the same day, not batched for month-end review
Escalate exceedances fast: a work order fired the moment a reading crosses limit, corrective action logged with timestamp
Stop Chasing Exceedances After The Fact
OxMaint logs every PM10 and PM2.5 reading against your permit thresholds, tracks filter and ESP maintenance, and fires a work order the moment a limit is crossed. Sign up for a free trial to run it on your own plant data, or book a demo to see it configured for your site.
Source, Primary Pollutant & Control Method
| Source |
Primary Concern |
Control Method |
| Kiln Stack |
PM10 and PM2.5, continuous emissions |
Bag filter or ESP, daily pressure checks |
| Finish Grinding |
Respirable silica-bearing dust |
Enclosed mill housing, local exhaust ventilation |
| Haul Roads |
Fugitive PM10 at fenceline |
Water spray or chemical suppressant, regular application |
| Storage Piles |
Wind erosion, fugitive PM10 |
Covered storage or windbreak barriers |
The Takeaway
Air quality compliance at a cement plant isn't decided by the reading itself, it's decided by how fast the plant responds once a reading crosses threshold. A sampler that isn't calibrated or a filter check that's overdue turns a manageable trend into an unexplained exceedance on the permit record.
Frequently Asked Questions
Q
What's the difference between PM10 and PM2.5 monitoring?
PM10 refers to particles up to 10 microns, coarse enough to be trapped in the upper airway, while PM2.5 covers finer particles that reach deep into the lungs and bloodstream. Cement plants typically need to monitor both, since regulators track them separately with different exposure limits.
Q
Where should dust samplers be placed at a cement plant?
Effective coverage requires samplers at the stack for point-source emissions, at the fenceline for fugitive dust, and near the nearest sensitive receptor such as a residential area. Relying on stack data alone misses conveyor, road, and stockpile sources that drive most community complaints.
Q
What causes most PM10 exceedances at cement plants?
A degraded bag filter or ESP is the most common cause of a stack exceedance, while unpaved haul roads and uncovered storage piles are the leading cause of fugitive fenceline exceedances. Both are preventable with a maintenance schedule tied directly to the monitoring data.
Turn Every Dust Reading Into A Trend You Control
OxMaint tracks PM10 and PM2.5 readings against your permit limits, ties filter and ESP maintenance to compliance, and fires a work order the moment a threshold is crossed. Sign up for a free trial to run it on your own plant data, or book a demo to see it configured for your site.