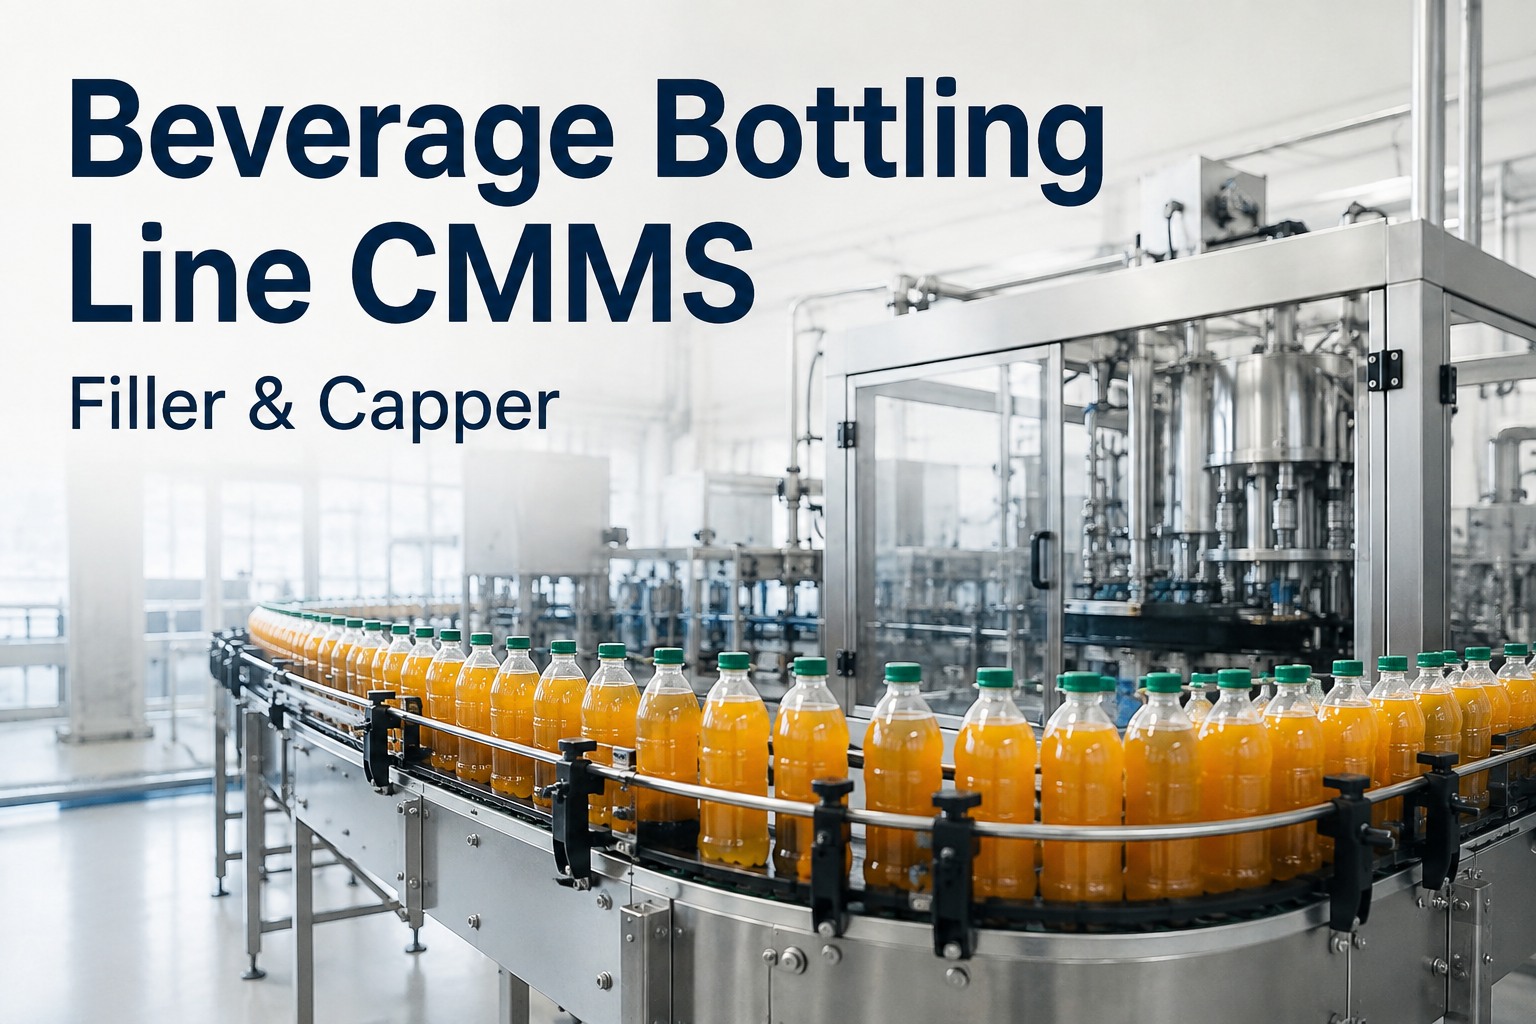
At 1,200 bottles per minute, a bottling line is one of the most unforgiving environments in manufacturing. A worn filler valve, a misaligned capper, a labeller with a drifting sensor — none announce themselves until the line stops. And when a bottling line stops, it costs £15,000 to £25,000 per hour. What most plants get wrong is where they look for the cause. Leadership blames the filler. The actual OEE thief is almost always downstream. An beverage bottling line CMMS demo — book a free Oxmaint walkthrough shows the workflow.
The Real Downtime Attribution
Where UK Bottling Lines Actually Lose Their Hours
Real UK multi-SKU line · reported filler-constrained · engineering review revealed a different picture
0%
Share of total downtime
30%
The reveal
52%
of availability loss traced to labeller + case packer micro-stops · not the filler that leadership was ready to replace
The Bottleneck Cascade: One Station Stops, Two Neighbours Suffer
Bottling lines are the classic linear cascade system. When any station stops, the effect radiates in both directions — upstream stations back up until they hit their accumulator limit and then stop themselves, and downstream stations run dry and stop for lack of product. This is why a single labeller micro-stop of 90 seconds can produce 4 minutes of actual line downtime. The maintenance system that models this cascade rather than treating each station as an island turns single-point PMs into line-level reliability.
Cascade Impact When a Station Stops
Upstream backup · point of failure · downstream starvation
Scenario: Capper jam
90-second stop
Rinser
backs up
Filler
backs up
Capper
stopped
Labeller
starving
Case packer
idle
Real line impact: 4 min 20 sec · recovery includes upstream restart + downstream priming
Scenario: Labeller roll change
3-minute stop
Rinser
backs up
Filler
backs up
Capper
backs up
Labeller
stopped
Case packer
idle
Real line impact: 7 min 10 sec · four assets touched by one roll change
The Capper: Where Torque Is a Food Safety CCP
Cappers are the second CCP many bottling plants forget to treat as CCPs. Under-torqued closures let oxygen ingress, shortening shelf life and inviting consumer complaints. Over-torqued closures crack, cause consumer difficulty opening, and generate returns. The correct torque is a narrow window per closure type, and every capping head has its own drift signature. Maintenance treats the capper as a torque-critical asset with per-head calibration and cycle-count-driven PM. Teams evaluating capper torque tracking in a live workspace can book a free demo of the capper CCP module.
Capper Torque Windows — Per Closure Type
28mm PET water
14–18 in·lb
33mm carbonated soft drink
17–22 in·lb
Glass twist-off (juice)
15–19 in·lb
Aluminium ROPP wine/spirits
12–20 in·lb
Under-torque · leak · oxygen ingress
Target window
Over-torque · closure cracks · consumer difficulty
See a Live Bottling Line Workspace
Watch a 30-minute demo of Oxmaint configured for fillers, cappers, labellers, case packers and palletisers — with per-station attribution and per-head torque tracking built in.
Micro-Stops: The OEE Thief Nobody Records
A micro-stop lasts seconds. A photo-eye trips, a bottle jams, an operator clears it, the line restarts. Nobody logs it because it feels beneath the reporting threshold. But across a shift, micro-stops routinely accumulate to more availability loss than any major breakdown. The plants operating at world-class 85%+ OEE all share one behaviour: they log every micro-stop with its cause code, pattern the causes, and treat recurring patterns as maintenance opportunities. This is where 15 to 29 percent OEE improvements actually come from in documented deployments. Teams new to micro-stop pattern capture can sign up free to explore the OEE workspace before rolling it across the plant.
Micro-Stop Pattern Recognition
Pattern
Photo-eye trips every 12–14 bottles
Root cause
Bottle tracking alignment drift · conveyor guide worn
Action
Conveyor guide replacement WO issued
Pattern
Labeller stops 2–3 times per SKU changeover
Root cause
Registration sensor loses lock on new label roll
Action
Sensor recalibration added to changeover PM
Pattern
Case packer flap folder jams late shift
Root cause
Case blank magazine feed timing drift
Action
Magazine feed cam inspection scheduled
Pattern
Filler valve rejects rise mid-shift on hot days
Root cause
Product temperature rise affecting fill height
Action
Chiller inspection · ambient linked to fill quality
Changeover: The Silent OEE Compounder
Changeover time is where shift-to-shift variance becomes an availability leak. Two shifts running the same SKU changeover with a 15-minute difference between them, four times a week, compounds to 52 hours of lost availability per year on a single line. The plants that get this right merge SKU changeover procedures with PM tasks into one ordered work-order stream — so the technician sees a single sequence to execute rather than juggling a changeover checklist plus a PM list. Documented industry patterns show 25 to 40 percent reduction in average changeover time from this integration alone. To see the unified workflow in a live workspace, book a free demo of the changeover integration.
Bottling Line Changeover — Fragmented vs Unified
Fragmented
Changeover checklist + PM list managed separately
62 min
Average changeover
Technician juggles two documents
PMs deferred because "the checklist is priority"
Shift-to-shift variance up to 20 min
Unified
Merged into one ordered work-order stream
40 min
Average changeover
Single ordered task list per changeover
PMs pre-slotted into the changeover window
Shift variance below 5 min
Expert Perspective: The Filler Is Rarely the Real Constraint
Every bottling line project I have reviewed in the last decade starts with the same assumption from operations leadership: the filler is the constraint, we need capex to replace it. The engineering review almost never agrees. The filler is rarely the real bottleneck — the real bottleneck is a labeller or case packer accumulating short-duration losses that never show up on the main incident report. The plants that recover the 16-point OEE gap between average and world-class do it not by buying new equipment, but by making the invisible losses visible: micro-stops logged, patterns identified, PMs scheduled against the actual failure signature.
Log
Every micro-stop captured
Stops down to 30 seconds captured with cause code · patterns become visible over shifts and days.
Map
Cascade impact modelled
One station stop translates to actual line impact including upstream backup and downstream starvation.
CCP
Torque tracked per capping head
Every head on a rotary capper carries individual torque history · drift caught before it becomes a leak.
UK Bottling Context: BRCGS, Sugar Levy, and Line Diversity
UK bottling lines pack an unusually wide range of products under an unusually tight regulatory umbrella. BRCGS Food Safety issue 9 provides the audit floor. The Soft Drinks Industry Levy has compressed margins across carbonates, making every OEE point worth serious money. Recyclability and EPR obligations sit over the material choices. And the UK own-label channel means most bottling co-manufacturers pack for multiple retailers, each running their own audit protocol. A CMMS that treats OEE data, CCP evidence, and PM records as one integrated output changes both the compliance experience and the plant economics. To scope this against your UK operation, book a free demo scoped to BRCGS and UK bottling requirements.
01
BRCGS + retailer audit stack
CCP challenge test evidence, PM records, and calibration certificates in one filterable evidence pack per BRCGS clause and per retailer scope.
02
Sugar Levy margin pressure
Every recovered OEE point on a mid-scale bottling line is worth £150,000 to £400,000 annual throughput. Availability leaks translate directly to bottom line.
03
Multi-format line diversity
One plant may run PET, glass, and can lines. Per-format PM profiles and per-SKU changeover procedures held as CMMS configuration.
A Realistic Rollout for a UK Bottling Line
A bottling line CMMS rollout should follow the diagnostic pattern above. Downstream stations first — because that is where the real availability leaks live. Filler and capper second — because that is where the CCPs sit. Utilities and support last. A phased plan captures micro-stop pattern recognition value inside the first month.
Weeks 1–4
Labeller + case packer
Labeller + case packer asset register
Micro-stop cause code capture live
Cascade impact model configured
Changeover procedures merged with PM
Weeks 5–8
Filler + capper CCPs
Per-valve filler tracking · cycle counts
Per-head capper torque monitoring
Rinser pressure baseline capture
Fill height + torque calibration cadence
Weeks 9–12
Palletiser + audit
Palletiser + conveyor drive PMs
Metal detector + CCP challenge cadence
BRCGS issue 9 evidence packs
OEE dashboards per line live
Recover the 16-Point OEE Gap on Your Line
Let Oxmaint show you a bottling line workspace configured for your fillers, cappers, labellers and packing — with attribution, cascade impact and torque tracking built in.
Frequently Asked Questions
Can Oxmaint attribute downtime to the actual failing station rather than the visible one?
Yes. Each downtime event is captured against the originating asset with cause code, duration, and shift context. Cascade impact — upstream backup and downstream starvation — is modelled per line topology, so leadership sees the true attribution rather than the surface pattern. This is how bottling plants routinely discover that labeller or case packer micro-stops are the real OEE thieves, not the filler that appeared to be the constraint.
How does the platform track capper head torque per head?
Every capping head on a rotary capper is held as an individual asset with its own torque calibration history, cycle counter, and drift trend. Torque head inspection PMs are triggered on cycle count rather than calendar. Deviations from the target window flag as blocking events on the affected head, and the full torque history is retained for BRCGS audit evidence and product complaint investigation.
Does the CMMS capture and pattern micro-stops?
Yes. Micro-stops down to 30 seconds are captured either through operator entry or through integration with the line control system. Cause codes are logged per event, and patterns are surfaced automatically — repeated causes at similar times of shift, similar SKUs, similar changeover contexts. This transforms micro-stops from an invisible OEE leak into a structured maintenance improvement queue, which is where documented 15 to 29 percent OEE improvements come from in this segment.
Can changeover procedures and PM tasks live in one work-order stream?
Yes. Format change activities, label roll swaps, cap tooling changes, and PM tasks scheduled inside the changeover window all appear as an ordered task list per changeover event. The technician works from a single stream, every task is signed off before line restart, and shift-to-shift variance typically compresses from 15 to 20 minute swings down to under 5 minutes. Aggregate changeover time typically reduces 25 to 40 percent per documented industry patterns.
Does the platform support BRCGS Food Safety issue 9 for bottling operations?
Yes. Capper torque calibration records, fill height verification, CIP evidence for fillers running food-contact product, metal detector challenge tests, and calibration certificates for all critical measurement equipment are captured as scheduled work orders with completion sign-off. Evidence packs can be filtered per BRCGS clause and per retailer scope on demand — removing the reconstruction scramble that used to characterise this work.