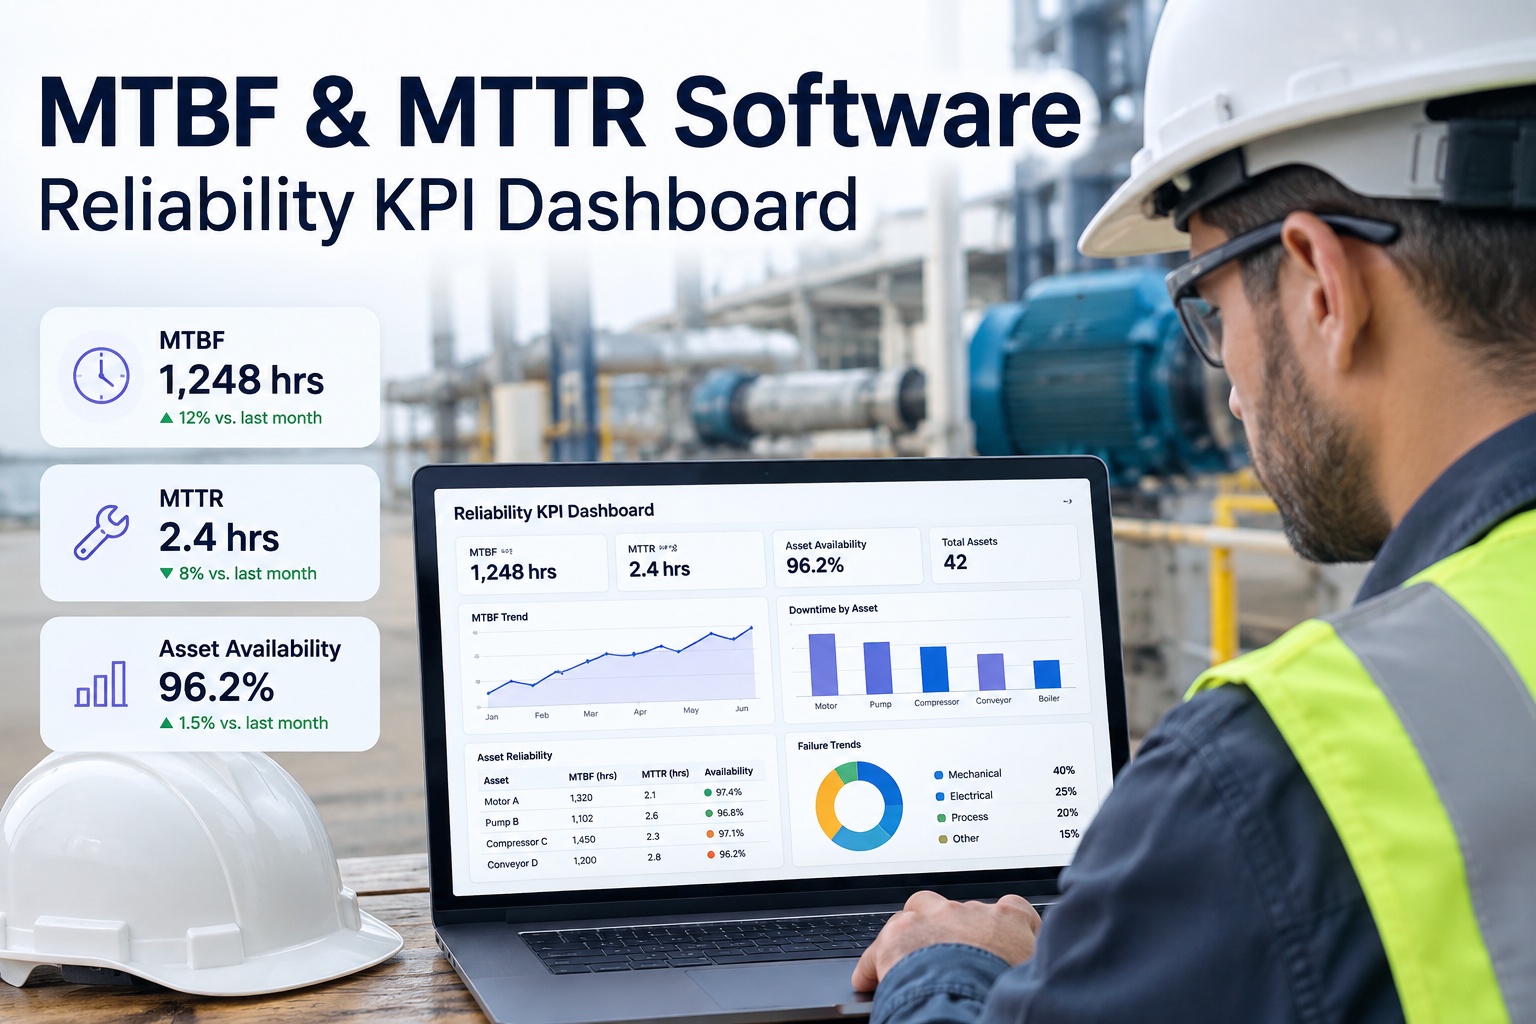
Two questions define reliability: how often does this asset fail, and how fast can we get it back? MTBF (Mean Time Between Failures) answers the first. MTTR (Mean Time To Repair) answers the second. Together they give you the Availability number your operations director reports to the board. Most UK maintenance teams still calculate them in a spreadsheet once a month — because the data lives across work orders, downtime logs and shift handovers nobody has stitched together. Oxmaint calculates all three live from your work-order data. Book a demo to see live reliability KPIs in action.
The Reliability Quadrant — Where Your Assets Actually Sit
MTBF and MTTR on their own tell half a story. The relationship between them is the whole story. A high-MTBF/low-MTTR asset is reliability heaven. A low-MTBF/high-MTTR asset is a production emergency waiting to be re-declared. Most UK sites have assets in all four quadrants — and the value of tracking both metrics live is knowing which quadrant every asset actually sits in, not the average across the plant.
MTBF
HIGH
RELIABILITY HEAVEN
High MTBF · Low MTTR
Rarely fails · quickly recovered
Action: replicate practices to lower quadrants
RELIABLE BUT SLOW
High MTBF · High MTTR
Rarely fails · painful when it does
Action: improve spares kit & response plan
LOW
RESILIENT BUT FRAGILE
Low MTBF · Low MTTR
Fails often · bounces back fast
Action: root-cause analysis on failure pattern
CRITICAL RISK
Low MTBF · High MTTR
Fails often · slow recovery
Action: capex candidate or full RCA immediately
LOW
HIGH
MTTR
The Live KPI Dashboard — What Reliability Data Should Actually Look Like
Monthly spreadsheet rollups are how MTBF/MTTR reporting fails in practice — data is stale by the time anyone sees it, and the underlying work orders have moved on. A live reliability dashboard updates as work orders close, calculates per-asset trends, flags declining performance and shows the exact contribution each failure event made to the number. The mockup below shows the shape of the KPI view Oxmaint delivers.
MTBF · Plant Avg
342hrs
▲ 12% vs prev 90d
MTTR · Plant Avg
2.8hrs
▼ 18% vs prev 90d
Availability
99.2%
▲ 0.6pp vs prev 90d
Assets Below Target
7/142
▼ 3 assets recovered
Attention Required · Assets with Declining Reliability
Compressor-04 · Line 2
MTBF 187h ▼28%
MTTR 4.2h
CRITICAL RISK
Conveyor-Skid-11
MTBF 220h ▼15%
MTTR 1.8h
FRAGILE
HVAC-AHU-East
MTBF 890h ▼8%
MTTR 6.4h
SLOW
Every KPI is calculated from work-order data — no spreadsheet extraction, no month-end reconciliation. Sign up free to see the reliability dashboard live.
See Live Reliability KPIs on Your Assets
Walk through the reliability dashboard, MTBF/MTTR trending per asset, quadrant analysis across your equipment base, and declining-reliability alerts — configured against your work-order history. Thirty minutes with the Oxmaint team.
Benchmarks — What "Good" Actually Looks Like for MTBF and MTTR
MTBF and MTTR benchmarks vary widely by industry. A process refinery reports MTBF in tens of thousands of hours; a general manufacturing conveyor motor is considered reliable at 4,000 hours; discrete manufacturing bearings sit at 500-1,500 hours depending on duty cycle. What matters is not comparing your number to someone else's — it's comparing your number to your own trend, and setting realistic targets per asset criticality tier rather than a single plant-wide figure that hides the assets actually at risk.
Process manufacturing
refining · chemicals · pulp & paper
MTBF: 10,000-50,000 hrs
MTTR: 4-24 hrs
Discrete manufacturing
automotive · assembly · food/bev
MTBF: 500-2,000 hrs
MTTR: 1-6 hrs
Facilities & utilities
HVAC · lifts · building systems
MTBF: 2,000-8,000 hrs
MTTR: 2-8 hrs
World-class benchmark
IEEE reliability standards
3-5× industry average MTBF
Critical assets under 2 hrs
Where Live MTBF/MTTR Tracking Changes Maintenance Decisions
The value of tracking these KPIs live — not monthly — is the decisions they enable. A rising MTTR on a specific asset class points straight at a spares availability gap. A dropping MTBF on a single line signals a systemic failure mode that RCA needs to unpick. An asset stuck in the "critical risk" quadrant justifies the capex conversation with real data rather than gut feel. And an availability number that survives audit scrutiny lets operations directors have credible conversations with the executive team about where to invest. Every one of these decisions gets better when the underlying numbers are calculated the same way every period, from the same raw work-order record. Sign up free to make reliability data drive real decisions.
Expert Perspective — Where MTBF/MTTR Tracking Actually Goes Wrong
"
The most common MTBF failure isn't calculation error — it's definitional drift. Teams under pressure to hit an MTBF target start quietly reclassifying failures: "that wasn't a breakdown, it was operator error"; "we'll call that scheduled maintenance"; "let's raise the duration threshold so short stops don't count." Six months later the MTBF number looks great and the assets are worse than ever. The same happens with MTTR — clock started at physical repair rather than failure detection, parts-waiting time excluded, diagnostic time attributed elsewhere. Real reliability tracking uses a fixed definition, applied consistently, calculated from the raw work-order record — not a curated version of it. That's the whole discipline.
01
Fixed failure definition
MTBF/MTTR calculated from the same failure definition every period. Definitional drift blocked at the workflow level.
02
Clock from failure detection
MTTR measures full downtime — detection to verified return-to-service. Parts wait, diagnosis, all in scope.
03
Per-asset criticality targets
Different MTBF/MTTR targets per criticality tier. One plant-wide number hides the assets that actually matter.
04
Trend, not snapshot
90-day rolling trend catches slipping reliability early. Point-in-time numbers only surface problems after they've hurt.
Who Uses Oxmaint for Reliability KPI Tracking
The platform is used by the specific UK operational roles that own reliability performance: reliability engineers running failure-mode libraries and RCA programmes across asset classes, maintenance managers tracking KPI trends to identify improvement opportunities, operations directors reporting availability to executive committees, plant managers benchmarking site performance against internal peers or industry standards, engineering managers targeting capex decisions with reliability data, continuous improvement teams driving OEE gains through MTBF and MTTR improvement, and facilities managers reporting building-system availability against SLA thresholds. Each role sees the same reliability data filtered to their view — asset trend, quadrant analysis, criticality-tier rollup or benchmark comparison. Sign up free to give your team live reliability KPIs.
Getting Reliability KPI Tracking Live
Deployment starts with importing your existing asset register and work-order history — Oxmaint back-calculates MTBF/MTTR from the historical record to establish the baseline before live tracking begins. Failure definitions and MTTR clock rules configure once at the site level to prevent definitional drift. Per-asset criticality tiers set the targets — critical assets typically under 2-hour MTTR, non-critical up to 6. The dashboard goes live within the first two weeks. Most sites see measurable MTTR improvement inside 60-90 days from mobile work orders and SOP standardisation; MTBF gains take longer — usually one to two quarters once condition-based PM and RCA become routine. Book a walkthrough to see live UK reliability deployments.
Turn Reliability Data Into Real Operational Leverage
Oxmaint gives maintenance, reliability and operations teams one platform for live MTBF, MTTR and Availability tracking — calculated from work-order data, trended per asset and site, with declining-reliability alerts before failures land.
Frequently Asked Questions
What are MTBF and MTTR?
MTBF (Mean Time Between Failures) is the average operating time between one failure and the next — calculated as Total Operating Time ÷ Number of Failures. It measures asset reliability: higher MTBF means the equipment fails less often. MTTR (Mean Time To Repair) is the average time to restore an asset to service after failure — Total Repair Time ÷ Number of Failures. It measures maintenance response: lower MTTR means faster recovery. Together they combine into Availability = MTBF ÷ (MTBF + MTTR), which is the single number most maintenance leaders report to operations directors and executive teams.
Does MTBF include planned maintenance downtime?
No. MTBF only counts unplanned failures and the operating hours between them. Scheduled PM downtime is excluded from both operating time and failure count so the metric reflects true asset reliability rather than maintenance schedule choices. Including planned downtime would confuse reliability performance with maintenance strategy — a well-maintained asset with frequent short PMs would look worse than one with no PMs at all, which is the opposite of what the metric should signal. Oxmaint applies this exclusion automatically based on work order type classification.
What is a good MTTR target for a manufacturing plant?
Most manufacturing plants target 1-6 hours MTTR depending on asset criticality. Critical line equipment should sit under 2 hours; non-critical assets can run 4-6 hours. Facilities and utility systems typically sit 2-8 hours. What matters more than any external benchmark is trend — MTTR should be flat or declining over time. Rising MTTR indicates parts availability issues, skill gaps or diagnostic time drift, and Oxmaint traces the root cause back to specific work-order events rather than treating the aggregate as a symptom.
Can a CMMS calculate MTBF and MTTR automatically?
Yes. Oxmaint pulls operating hours, failure events and repair durations from work-order data and computes MTTR, MTBF and Availability per asset, equipment class and site without manual analysis. Failure definitions and MTTR clock rules configure once at site level to prevent definitional drift. This eliminates the monthly spreadsheet rollup that most sites still rely on — the dashboard updates as work orders close, showing rolling 90-day trends and flagging assets whose reliability is declining before they cause production impact.
How quickly should MTBF and MTTR improve after deploying a CMMS?
Most sites see measurable MTTR improvement within 60-90 days — the gains come from mobile work orders, standardised SOPs, better spares availability and reduced diagnostic time. MTBF gains take longer, typically one to two quarters, because they require condition-based PM adjustments and root-cause analysis to become routine practice. World-class facilities (IEEE reliability standards) achieve MTBF 3-5× industry average with 25-35% higher asset availability, but this level requires sustained reliability programme investment beyond the CMMS itself — the platform provides the measurement discipline that makes the programme possible.