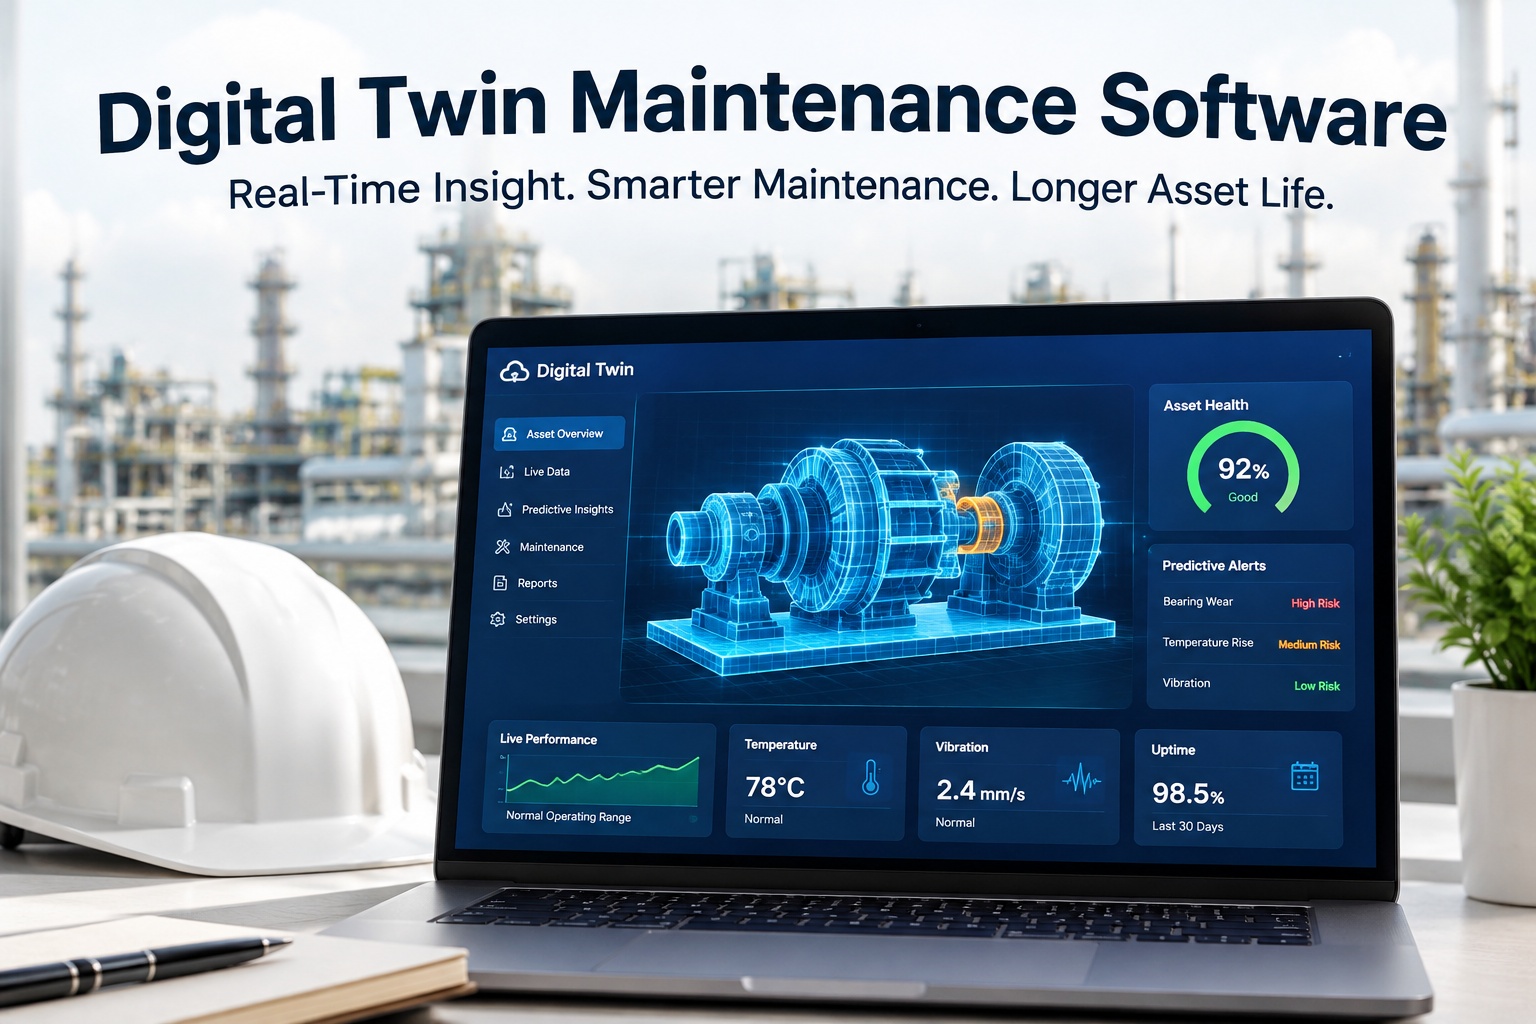
A digital twin is only worth building if it changes what your maintenance team does on a Tuesday morning. Oxmaint creates live digital twins of your critical assets by combining maintenance history, sensor readings, condition data and work order records into one continuously updated model, so reliability engineers can see failure risk changing, test a scenario before committing to it, and turn that insight into a scheduled job. Start a free trial or book a demo to see your own assets modelled.
Digital Twin Maintenance Software
Most digital twin projects stall because the model is beautiful and the decision never changes. This page explains what a maintenance digital twin genuinely does, what data it needs before it works, and the sequence that gets UK operations to a measurable result rather than a demonstration.
The mirror: physical asset, live model
A twin is not a 3D picture. It is a mirror that updates itself, fed by four streams that most sites already generate separately.
- Centrifugal pump, 45 kW
- Vibration, temperature, current
- Running hours and duty cycle
- Nine years of work orders
- Bearing replaced twice
- Modelled wear state
- Deviation from normal signature
- Remaining useful life estimate
- Failure mode ranked by likelihood
- Scenario: what if we run to Friday
Digital twin or predictive maintenance? Both, in order
These get sold as alternatives. They are not. Predictive maintenance is a strategy that forecasts failure. A digital twin is the infrastructure that lets you ask what happens next.
| Question | Predictive maintenance | Digital twin |
|---|---|---|
| What it answers | Is this asset heading for failure | What happens if we change something |
| Built from | Sensor data plus failure history | Sensor data, history, specification and physics |
| Minimum data | Months of readings on the asset | Years of structured records plus live feeds |
| Typical first result | Downtime reduction within 90 days | Better capital and scheduling decisions |
| Where it fails | Poorly coded work orders | Being built before the data exists |
Scroll the table sideways on a smaller screen.
The barrier is no longer cost. It is data readiness
Sensors got cheap. Cloud compute got cheap. What did not get cheap is nine years of maintenance records written properly. Check where your operation sits before anyone quotes you.
Failing two or three of these means the foundation work is the project. Oxmaint is where that foundation gets built.
What the numbers actually say
Market context: predictive maintenance reaches USD 15.67bn in 2026 and compounds at 22.4% to 2035, while unplanned industrial downtime costs manufacturing an estimated USD 864bn a year. Manufacturing leads adoption at roughly 23% share.
Four things a twin lets you do that a dashboard cannot
The sequence that works
Operations that jump straight to simulation usually abandon it. Gartner expects more than 40% of agentic AI projects to be dropped by 2027 on complexity and cost. This order avoids that.
Start with these assets
Rotating machinery, process equipment and control systems deliver the fastest return. Low-criticality assets rarely justify the modelling effort.
Questions we get asked
See your own assets modelled
Bring a list of your ten most critical assets to a thirty minute session and we will show you what a twin would look like on your plant, what data you already have and what is missing. No obligation, and the free trial runs without a credit card.







