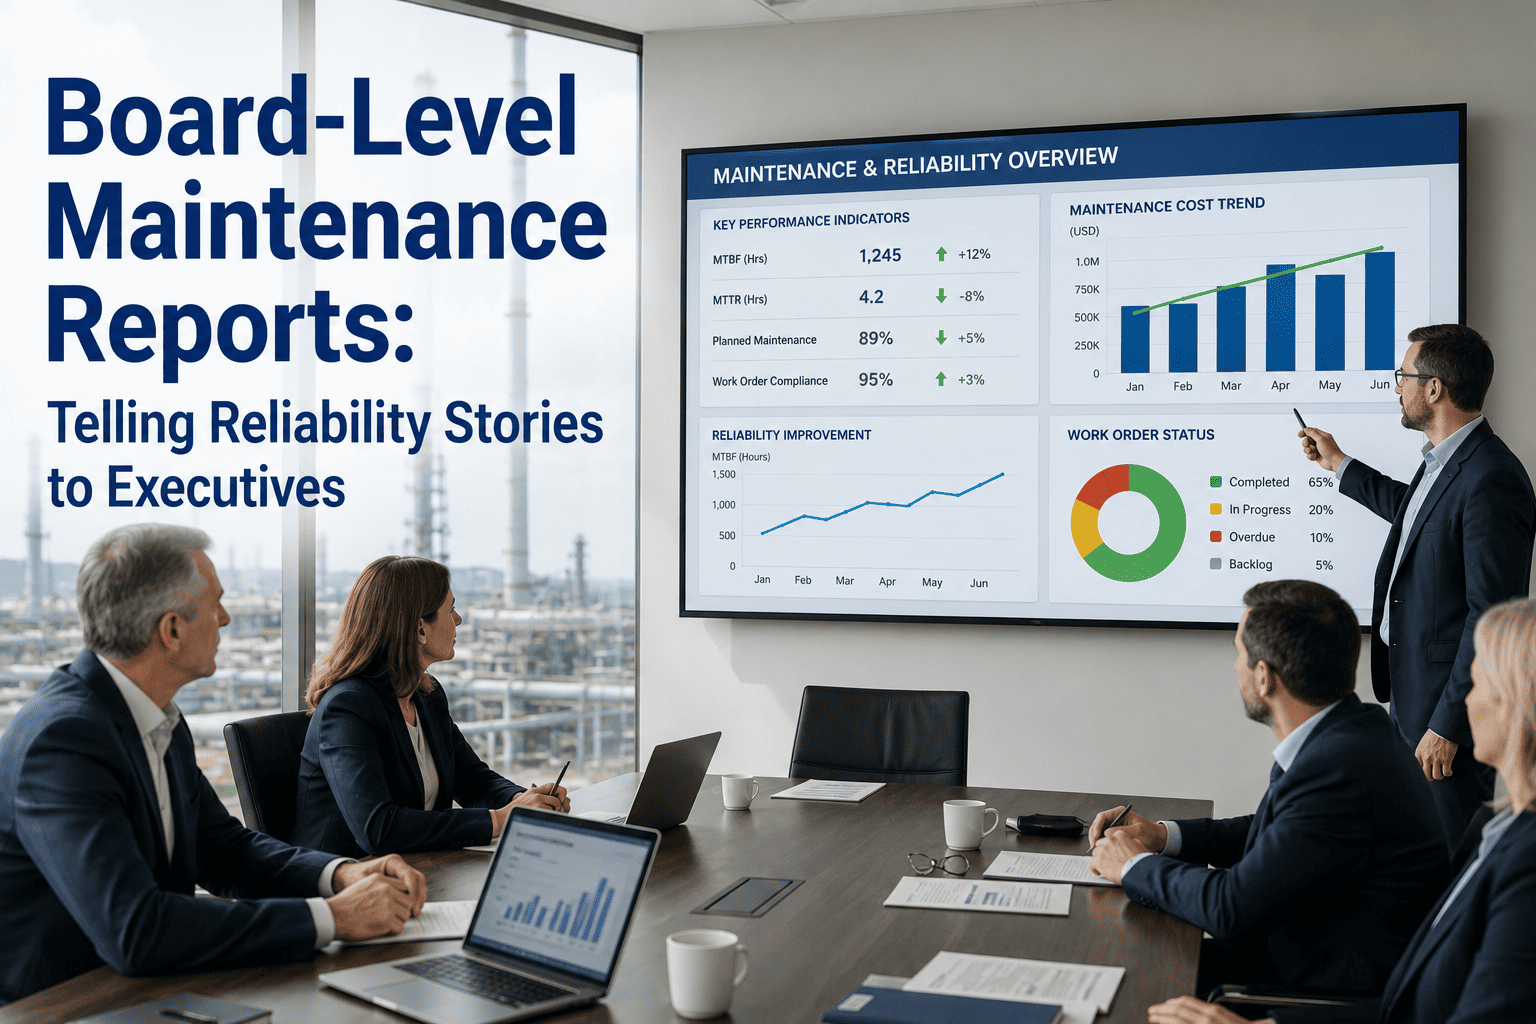
The maintenance report that lands on a board table every quarter is usually prepared by someone who knows what PM completion rate means — and presented to people who do not care. This is not a communication failure. It is a translation failure. Executives make decisions about cost, risk, growth, and resilience. Every reliability metric your team tracks has a direct story to tell in those four languages. The engineering director's job is to tell it.
Board-Ready Maintenance Reports Built Automatically From Your Work Order Data
OxMaint calculates OEE, cost-per-unit, MTBF trend, and schedule compliance continuously — and rolls them into a board-level view with financial context, no manual assembly required. Sign up free or book a demo to see the executive dashboard live.
What Boards Actually Need to Know
Board members spend an average of four minutes reviewing the metrics section of any operational report. That is not indifference — it is prioritisation. Boards govern around four questions, and every metric you bring to the table needs to answer at least one of them clearly.
A maintenance report that answers none of these is an operational update that belongs in a management meeting, not a board pack. Sign up free on OxMaint to build the financial context layer that makes your reliability data board-ready.
The Translation Table: Engineering Metric to Board Language
Every technical maintenance metric has a board equivalent. The table below is the core of any effective engineering director's board report — the direct translation between what your CMMS measures and what the boardroom hears.
| Engineering Metric | What It Measures | Board Language | Audience |
|---|---|---|---|
| OEE % | Availability × Performance × Quality | "We are using X% of the productive capacity we are paying for. The gap costs us approximately £Y per quarter." | CEO, CFO |
| MTTR (hours) | Average recovery time after failure | "When a critical asset fails, we are offline for an average of X hours. At £Y/hour production value, each event costs £Z." | CFO, COO |
| MTBF (hours) | Average time between failures | "Our most critical assets fail every X hours on average. Trend is improving / declining — here is what that means for capacity commitments over the next 12 months." | CEO, COO, NEDs |
| PM Compliance % | Preventive tasks completed on schedule | "This is our leading indicator of future risk. A drop from 95% to 75% compliance predicts rising failure rates within 60–90 days. We are currently at X%." | Risk Committee, NEDs |
| Maintenance Cost per Unit | Total maintenance spend ÷ output | "Our maintenance cost per unit produced is £X, against a target of £Y. The variance is driven by Z — here is the plan to close it." | CFO, Audit Committee |
| Emergency Work Ratio % | Reactive vs. total maintenance hours | "X% of our maintenance hours last quarter were unplanned emergency response. World-class is below 15%. We are at Y% — here is the trajectory." | CEO, COO |
How to Structure a Board Maintenance Report
Board members should be able to understand the state of your maintenance operation in five seconds (headline), five minutes (summary), and fifty minutes (full report with appendix). Build the report for all three timeframes. Most engineering directors only prepare for the fifty-minute version — and present it to a room that stopped reading at page two.
The Four Stories That Win Board Confidence
Engineering directors who command strong board confidence do not report metrics — they tell one of four stories, each mapped to the board's language. Book a demo to see how OxMaint gives you the data architecture to tell all four, from a single dashboard.
What Not to Put in a Board Report
The fastest way to lose board engagement is to put the wrong things on the page. The following items belong in management reports, not board packs. Including them signals that the report was not prepared with the audience in mind.
The Six Metrics That Belong in Every Board Maintenance Pack
All six of these are calculated automatically in OxMaint from work order data, with no manual assembly. Sign up free to start generating board-ready outputs from your next closed work order.
Presenting to the CFO: The Financial Frame That Works
The CFO is usually the most sceptical audience in the room for a maintenance report. Their mental model for maintenance is a cost centre to be controlled, not a value driver to be invested in. Changing that model requires speaking in one language: money.
Stop Assembling Board Reports by Hand — Let Your Work Orders Build Them
OxMaint produces the six board-level metrics automatically from your day-to-day maintenance data, with 12-month trend charts, site comparisons, and the financial context layer that translates reliability into language boards act on. Sign up free or book a demo to see the executive dashboard configured for your operation.
Frequently Asked Questions
How many maintenance metrics should appear in a board report?
No more than six on the primary summary page. Board members spend an average of four minutes reviewing the metrics section of any operational report, and working memory limits engagement sharply beyond five to nine items. The six that belong in every board maintenance pack are OEE, maintenance cost per unit, PM compliance, MTTR on critical assets, MTBF trend, and emergency work ratio. Everything else belongs in the appendix, referenced rather than presented.
How do you translate OEE into financial language for a CFO?
Start with the gap, not the number. A plant running at 74% OEE against a world-class benchmark of 85% has an 11-point gap. Calculate the production hours that gap represents at current throughput rates, multiply by average revenue per production hour, and present that as the financial opportunity — or the cost of the current state. Most CFOs respond to "our current OEE gap costs us approximately £X per quarter in unrealised production capacity" far more than they respond to "our OEE is 74%."
What is PM compliance, and why does it matter to a board?
PM compliance is the percentage of scheduled preventive maintenance tasks completed on time. It matters to a board because it is a leading indicator — the only one in most standard maintenance packs. A drop in PM compliance from 91% to 76% reliably predicts a decline in MTBF and a rise in emergency work within 60 to 90 days. Presented to the board as a forward-looking risk signal, PM compliance shifts maintenance reporting from historical review to risk management — which is a board-level function.
How should an engineering director present a maintenance cost overrun to the board?
Lead with cause, impact, and plan — in that order. "Our maintenance cost per unit is 4% above plan this quarter. The primary driver is a 13-point increase in reactive work hours on Line 2, triggered by a recurring bearing failure mode we have now root-caused. The corrective action is in progress and we expect to return to plan by mid-Q3." A board does not want to discover cost overruns — but once they exist, a clear causal narrative with a recovery timeline is far stronger than a table of numbers and no explanation.
What does MTTR look like in board-level language?
MTTR becomes a resilience metric when you attach a financial value to it. "When our most critical asset fails, we are offline for an average of 3.5 hours. At our standard production throughput rate, each event represents approximately £X in lost output. We have reduced MTTR by 18% year-on-year through pre-staged parts and faster diagnostic protocols — equivalent to recovering £Y per quarter that would otherwise have been lost to downtime." That is a board-level statement. "Our MTTR is 3.5 hours" is not.