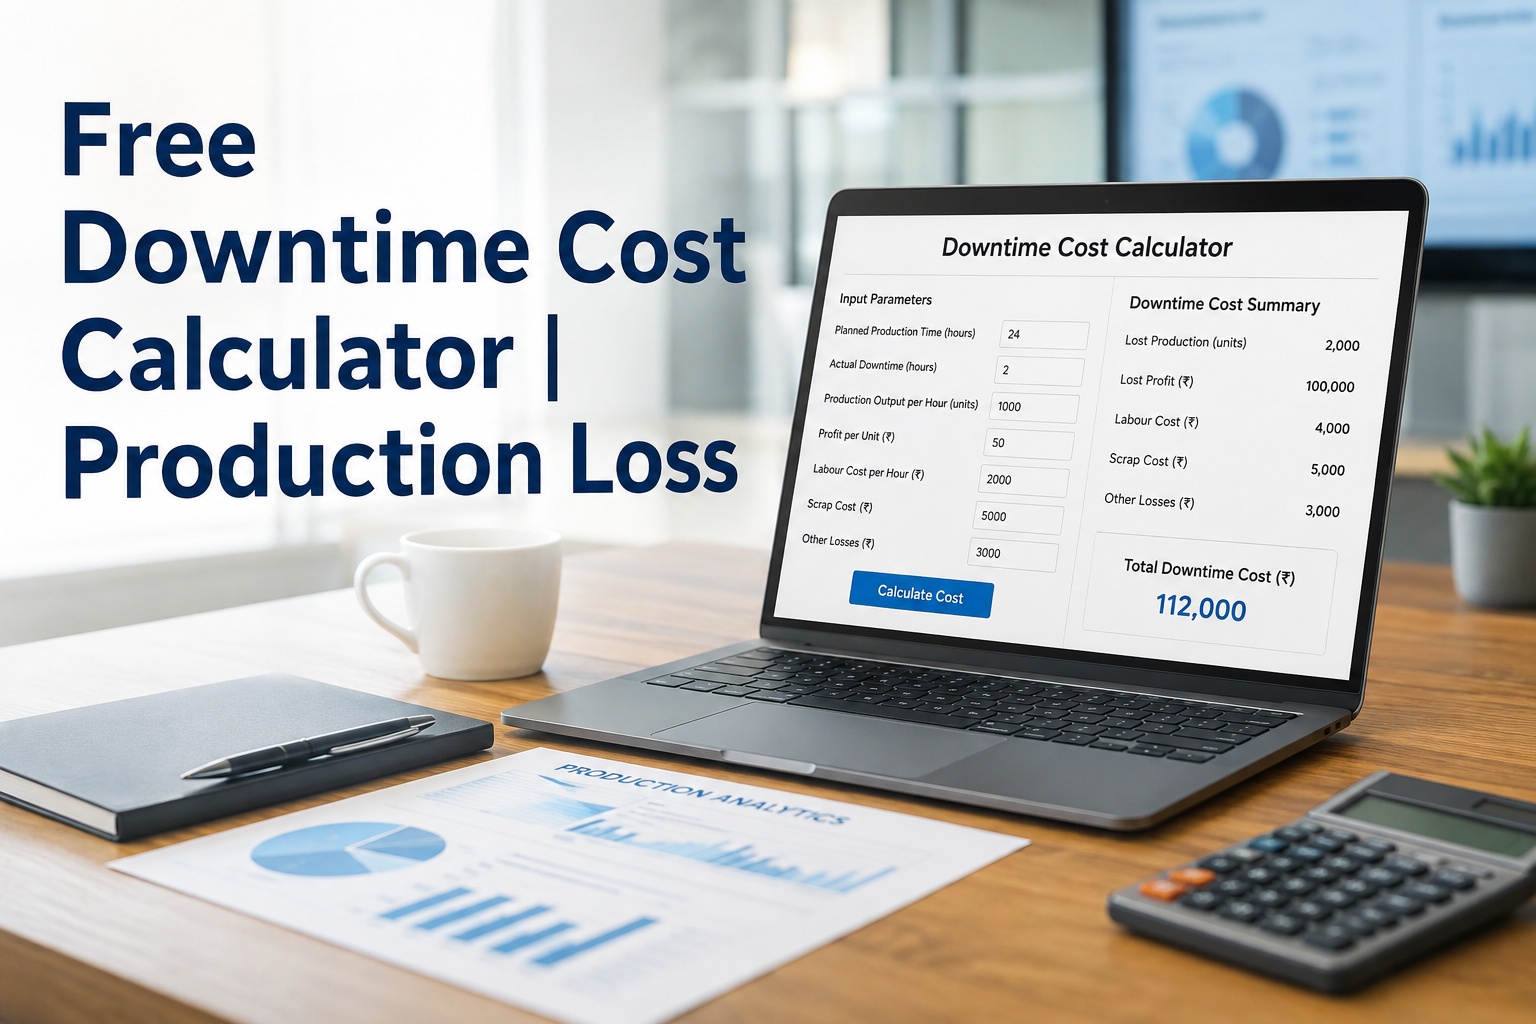
Most plants calculate downtime cost the same way: hours down times hourly production value. That number is wrong — usually by 40 to 60%, and always in the same direction. The moment a line stops, several other costs start bleeding in parallel: labour still gets paid, overhead still runs, and maintenance often gets called in at premium rates. This page gives you the full formula, a worked example, and the categories most plants miss entirely. Sign up free and let OxMaint track this automatically from your live downtime data.
Each variable in this formula is specific to your own operation — there's no universal number that works across every plant or product line.
Treat the categories as a checklist, not a formula to memorise — missing one is far more common than getting the maths wrong.
Why the "Obvious" Number Is Always Too Low
Calculating downtime cost as hours lost times hourly production value captures only the direct effect. Research consistently shows the true cost runs 2 to 4 times higher than that direct production-loss figure once hidden categories are included — and the gap is invisible until someone actually adds up the other categories.
The direction of the error is always the same: every plant we've seen underestimates, never overestimates, because the missing categories are the ones nobody tracks by default.
That consistency is actually useful — it means the fix is the same everywhere too: count all six categories, every time.
Most plants only calculate the first one or two categories, which is exactly where the 40-60% underestimate comes from.
Working through all six doesn't take much longer than calculating one — it just requires knowing to look for the other five.
A Fully Worked Example
Formulas are easier to trust with real numbers behind them. Here's a single 6-hour unplanned stoppage on a line producing goods worth £4,000 per hour in margin.
Every figure below is illustrative — plug in your own line's production value, labour rate and headcount to get a number specific to your operation.
Scale this across a year of similar events and the gap between the obvious number and the true one becomes a figure leadership can't ignore.
Most plants run more than one unplanned stoppage a month — multiply that £11,766 gap by twelve and the annual exposure becomes hard to overlook.
Where Plants Consistently Underestimate
The biggest gap usually isn't in the number people track — it's in the categories they don't track at all. Book a free demo to see every category captured automatically instead of reconstructed after the fact.
These four categories consistently show up as the difference between a plant's internal estimate and its actual annual downtime exposure.
None of them require sophisticated tooling to estimate — they require someone deciding to include them in the calculation at all.
None of these categories are hard to calculate individually — they're simply the ones nobody remembers to add up.
Expert Perspective: Making the Case for Prevention
Once a plant calculates its true downtime cost properly, the conversation about preventive maintenance investment usually writes itself. A single unplanned stoppage frequently costs more than an entire month's preventive maintenance budget — but that comparison only lands when the downtime figure includes every category, not just the obvious one. Under-calculating downtime cost is the single biggest reason PM budgets get cut.
That gap in visibility, more than the number itself, is usually what changes once the calculation is done properly.
Why Prevention Almost Always Wins the Comparison
Once a true downtime cost figure exists, the reactive-versus-preventive comparison rarely needs much persuading — the numbers tend to speak for themselves.
This comparison is often the single most persuasive number in a maintenance budget conversation, precisely because it's built from the plant's own data rather than an industry average.
No generic benchmark carries the same weight in a budget meeting as a number pulled from your own last breakdown.
Calculating This for Your Own Plant
Pull downtime records for your last three to five unplanned stoppages — most CMMS platforms, shift logs or production reports have this. For each event, calculate lost production using the actual margin for the product running, add labour and overhead for the duration, then layer in repair costs, scrap and recovery overtime. Sign up free and connect your downtime history to see this calculated for every event going forward.
An approximate figure across all six categories beats a precise figure covering only one — the goal is completeness, not perfect accuracy on day one.
Once you've done this for three or four events, a pattern usually emerges in which categories matter most for your specific operation.
That pattern is worth writing down — it becomes your plant's own quick-reference for future estimates.
Turning the Number Into Action
A true downtime cost figure is most useful compared against something — your current PM budget, a competing capital project, or last year's figure to show the trend. Once leadership sees the real number next to what prevention would cost, the investment conversation changes considerably. Book a free demo to see this comparison built for your own plant.
Revisit the calculation periodically rather than once — labour rates, margins and overhead all shift over time, and a downtime cost figure calculated two years ago is unlikely to still be accurate today.
Treat it as a living number that gets refreshed, not a one-off exercise filed away and forgotten.







