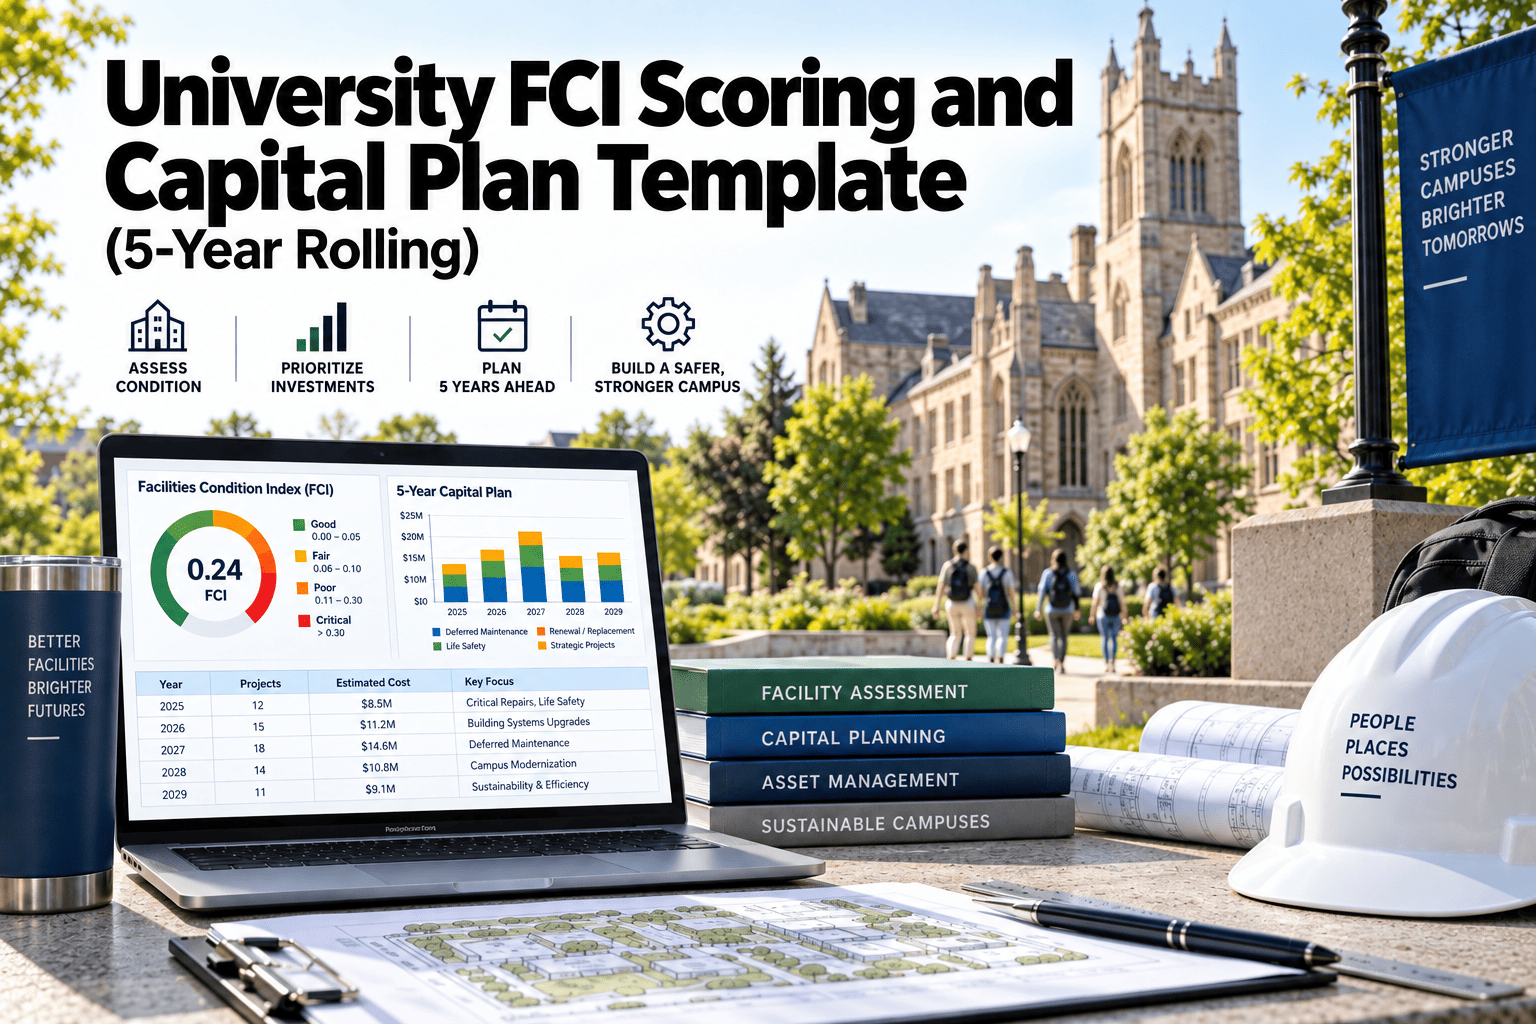
Facility directors are increasingly asked one question by their finance committee every budget cycle: how much of the campus is actually falling apart, and how much will it cost to fix. The Facility Condition Index, or FCI, is the number that answers that question in a single figure governors and bursars can actually compare year on year. Building an FCI score by hand means pulling a full asset list, rating the condition of every roof, boiler, and lift, pricing out replacement cost, and rolling all of it into a five year capital forecast before a single spreadsheet formula is written. Most estates teams already have the underlying data scattered across inspection notes, old capital works records, and a finance spreadsheet, but nobody has had the time to bring it together into one trusted number. This page walks through exactly what goes into that calculation and gives you a ready structure for a university FCI scoring and 5-year rolling capital plan, the same structure estates teams build directly inside Oxmaint AI once their asset data is in one place.
What Is FCI and Why It Drives Capital Planning
Facility Condition Index is a standard measure used across estates and facilities management to express how much of a building's value is tied up in deferred maintenance. It is calculated by dividing the total cost of outstanding repairs and renewals, known as the deferred maintenance backlog, by the current replacement value of the asset. The result is expressed as a percentage, and a lower number always means a healthier building. A campus with a rising FCI year over year is a campus quietly building up a repair bill that eventually lands as an emergency capital request instead of a planned one. Because FCI is a ratio rather than a raw cost figure, it also lets estates teams compare a 1960s teaching block against a newly built research centre on equal terms, which is exactly what a capital committee needs when it has to choose between competing renewal projects with a fixed annual budget.
What Goes Into the Template
A usable FCI template is not just a formula, it is a structured record of every building system on campus. Without all five pieces below sitting in one place, the score is either impossible to calculate or too unreliable to bring to a finance committee. The five components are what Oxmaint pulls together automatically from your asset and work order data, replacing the manual spreadsheet most estates teams start with.
1
Full Asset List
Every building, roof, HVAC unit, lift, and major system logged with an install date, exact location, and the team responsible for its upkeep.
2
Condition Rating
A consistent 1 to 5 scale applied during every inspection, so a boiler in one building is scored the same way as one in another across campus.
3
Replacement Cost
Current replacement value for each asset, updated against real contractor quotes rather than a figure fixed at purchase and never revisited since.
4
FCI Calculation
Backlog cost divided by replacement value, rolled up by building, by system type, and across the whole estate in one view.
5
5-Year Capital Forecast
Projected renewal spend spread across five years, so governors see a workable plan rather than a single alarming lump sum total.
Skip the manual spreadsheet. Oxmaint builds your FCI score and 5-year capital plan directly from your live asset and work order data.
Common Mistakes That Skew an FCI Score
An FCI figure is only as trustworthy as the data behind it, and the same handful of mistakes show up across almost every manually built report. Recognising them early saves a finance committee from making a decision based on a number that does not reflect reality.
A
Outdated Replacement Costs
Using a figure fixed at original purchase instead of current market cost quietly understates the true FCI every year, hiding backlog until a project suddenly costs far more than budgeted.
B
Inconsistent Condition Ratings
Different surveyors scoring assets on different scales makes buildings impossible to compare fairly against each other when the capital committee is deciding what to fund first.
C
Missing Minor Assets
Leaving out smaller systems like fire doors, drainage, or access control understates the backlog and the real capital need across the estate.
D
Treating It as a One Off Report
Calculating FCI once a year from scratch means the figure is already stale before it even reaches the finance committee for review.
E
No Link Back to Work Orders
A backlog figure that is not tied to actual scheduled repairs is a guess dressed up as a calculation, and it rarely survives an audit question.
Who This Template Is Built For
FCI scoring and rolling capital plans are used at every level of a university estate, and each audience tends to look for a different slice of the same underlying data set, which is exactly why the numbers need to live in one shared system rather than several disconnected files.
1
Estates Directors
Need a defensible, campus wide FCI figure they can present to governors alongside a funded five year plan they can stand behind confidently.
2
Capital Planning Managers
Need building by building detail to sequence renewal projects by risk, cost, and the annual budget actually available for capital works.
3
Maintenance Supervisors
Need the underlying asset condition data to feed directly from routine inspections without ever re-entering the same figures twice.
Reading Your FCI Score
Once a building or system has an FCI percentage, the next question is what that number actually means for the capital plan. Estates teams generally group scores into the bands below, moving from a well maintained asset through to one where replacement is more cost effective than continued repair.
0 to 5%
Excellent
Routine maintenance only, no near term capital spending is needed for this asset or building
5 to 10%
Good
Minor renewals emerging, worth planning ahead in the rolling five year forecast now
10 to 30%
Fair
Noticeable backlog forming, prioritise this building in the next capital funding cycle
30 to 60%
Poor
Significant renewal required soon, budget this as a priority project this year
Above 60%
Critical
Full replacement is usually more cost effective than continued patch repair work
Building Your 5-Year Rolling Capital Plan
An FCI score on its own is a snapshot. A rolling capital plan turns that snapshot into a funded schedule, spreading renewal spend across five years so no single budget cycle absorbs an entire backlog at once. Because the plan rolls forward rather than resetting each year, a project pushed from year one to year two does not disappear from the record, it simply moves with updated costs attached. The stages below are how estates teams move from a raw asset list to a plan the finance committee will actually approve.
1
Inspect and Rate Every Asset
Run condition surveys across roofs, plant, and building fabric, scoring each on the same consistent scale so results can be compared fairly across every building on the estate.
2
Price the Backlog
Attach a realistic repair or replacement cost to every asset scoring below an acceptable condition threshold, using current market rates rather than historic purchase figures.
3
Calculate FCI by Building
Roll the backlog and replacement value up to a single FCI percentage per building, by system type, and across the whole estate for a full picture.
4
Sequence Spend Across Five Years
Rank projects by risk, safety impact, and FCI improvement, then distribute the total backlog across a rolling five year budget rather than one large capital ask.
5
Refresh the Plan Every Year
Update condition ratings and costs annually, or continuously if tracked digitally, so the plan keeps rolling forward instead of going stale after the first year.
What a Manual FCI Process Costs You
Most estates teams do not lack the will to track FCI, they lack the time. Pulling asset data from spreadsheets, inspection notes from paper forms, and cost data from separate finance systems into one FCI figure can take weeks, and by the time it is finished the underlying condition data is already out of date. That delay has a real cost too, because a capital committee working from a stale figure either over funds a building that has already been partly repaired or, more commonly, under funds one where the backlog has grown since the last survey. The gap between the true condition of the estate and what the spreadsheet says widens every month the report sits unrefreshed, and it is usually the estates team, not the committee, who ends up explaining the difference the following year.
6 weeks
typical manual build time
Average time estates teams spend compiling an FCI report from spreadsheets and paper inspection forms.
40%
of data already stale
Portion of condition ratings estates directors describe as out of date by the time a manual report is finished.
1 day
with live asset data
Time it takes to generate an FCI report once condition ratings and costs are already tracked inside Oxmaint.
FCI and Compliance Reporting
Beyond internal budgeting, a documented FCI score has become something insurers, auditors, and in some cases grant funders expect to see as evidence that an institution understands and is actively managing its estate risk. A university applying for capital grant funding is in a stronger position when it can show a governing body approved, regularly refreshed FCI figure alongside a funded five year plan, rather than a verbal assurance that buildings are being looked after. Keeping that evidence current inside a single system also means an insurance renewal or a governors audit no longer triggers a scramble to rebuild the report from scratch, since every rating, cost, and completed repair is already timestamped and stored against the relevant asset.
Spreadsheet vs Template vs Live CMMS Tracking
Not every FCI approach delivers the same accuracy or the same speed, and the gap between them widens the longer an estates team relies on manual updates. The table below compares the three most common ways estates teams calculate and maintain their FCI score and capital plan.
| Method |
Data Freshness |
Effort to Update |
Audit Ready |
Capital Plan Output |
| Static spreadsheet |
Updated once a year at best |
High, fully manual |
Weak |
Single total, no timeline |
| Downloadable template |
As current as last entry |
Moderate, still manual entry |
Basic |
Structured but static |
| Oxmaint live tracking |
Updated as inspections happen |
Low, data flows from work orders |
Full digital history |
Rolling five year forecast |
Turn your asset register into a live FCI score and rolling capital plan your finance committee can trust every budget cycle.
Our old FCI report was a spreadsheet somebody rebuilt every summer from memory and a stack of inspection notes. By the time it reached the finance committee, half the numbers were already wrong, and nobody could say with confidence which buildings actually needed funding first. Now every condition rating and repair cost flows in as the work happens, so our FCI score and five year plan are current every time someone asks for them, not just once a year, and the governors trust the figure because they can see exactly where it comes from.
Head of Capital Planning, UK University
Frequently Asked Questions
These are the questions estates teams ask most often when they are building an FCI score and rolling capital plan for the first time, or switching over from a manual spreadsheet process.
What counts as a good FCI score for a university building?
Most estates teams treat anything under 10 percent as good condition requiring only routine maintenance, while scores above 30 percent usually signal a building that needs a prioritised renewal project rather than another round of reactive repairs.
How often should an FCI score be recalculated?
Annually at minimum, though teams tracking condition data inside
Oxmaint can view an updated FCI figure at any point since ratings and costs update automatically as inspections and work orders are completed throughout the year.
What is the difference between a capital plan and a maintenance budget?
A maintenance budget covers routine repairs and servicing, while a capital plan covers larger renewal and replacement projects identified through the FCI process, typically scheduled and funded across a five year rolling window rather than a single year.
Can a small college use FCI scoring, or is it only for large estates?
FCI scoring scales down easily to any size of estate. A college with a handful of buildings benefits from the same structure, and often finds it faster to reach a clean, current baseline than a large multi campus university.
How does Oxmaint turn asset data into a five year capital plan?
Oxmaint combines your asset register, condition ratings, and replacement costs to calculate FCI automatically, then sequences renewal projects across five years by risk and cost. You can
book a walkthrough to see it built around your own asset list and current backlog.
Turn Your Asset Register Into a Funded Capital Plan
Stop rebuilding your FCI report from scratch every year. Oxmaint keeps your condition ratings, replacement costs, and five year forecast current automatically.