Every hour your HVAC system sits broken, money walks out the door — in lost productivity, emergency callouts, energy waste, and tenant complaints. Yet most facility teams only discover the true cost of equipment failure after the damage is done. This guide gives you the numbers by building type, the hidden costs most teams overlook, and a framework to calculate what downtime is actually costing your operation right now. Start free on OxMaint and begin tracking your real downtime costs today.
Know Your True HVAC Downtime Cost — Before the Next Failure Hits
OxMaint helps facility teams log every repair event, track asset cost history, and surface failure patterns early — so you can act before equipment fails, not after.
Why HVAC Downtime Costs More Than You Think
The invoice from the emergency repair technician is visible. Everything else — the productivity lost, the energy penalty, the tenant churn — stays invisible on a spreadsheet. That gap between what facility teams report and what downtime actually costs is where budget overruns hide year after year. Sign up free on OxMaint to start capturing the full picture.
HVAC Downtime Cost by Building Type
Downtime cost is not one number — it varies dramatically by facility type, occupancy density, and how HVAC failure cascades into operations. Here is what the research shows across the four facility types with the highest downtime exposure. Book a demo to see how OxMaint maps these costs to your specific asset inventory.
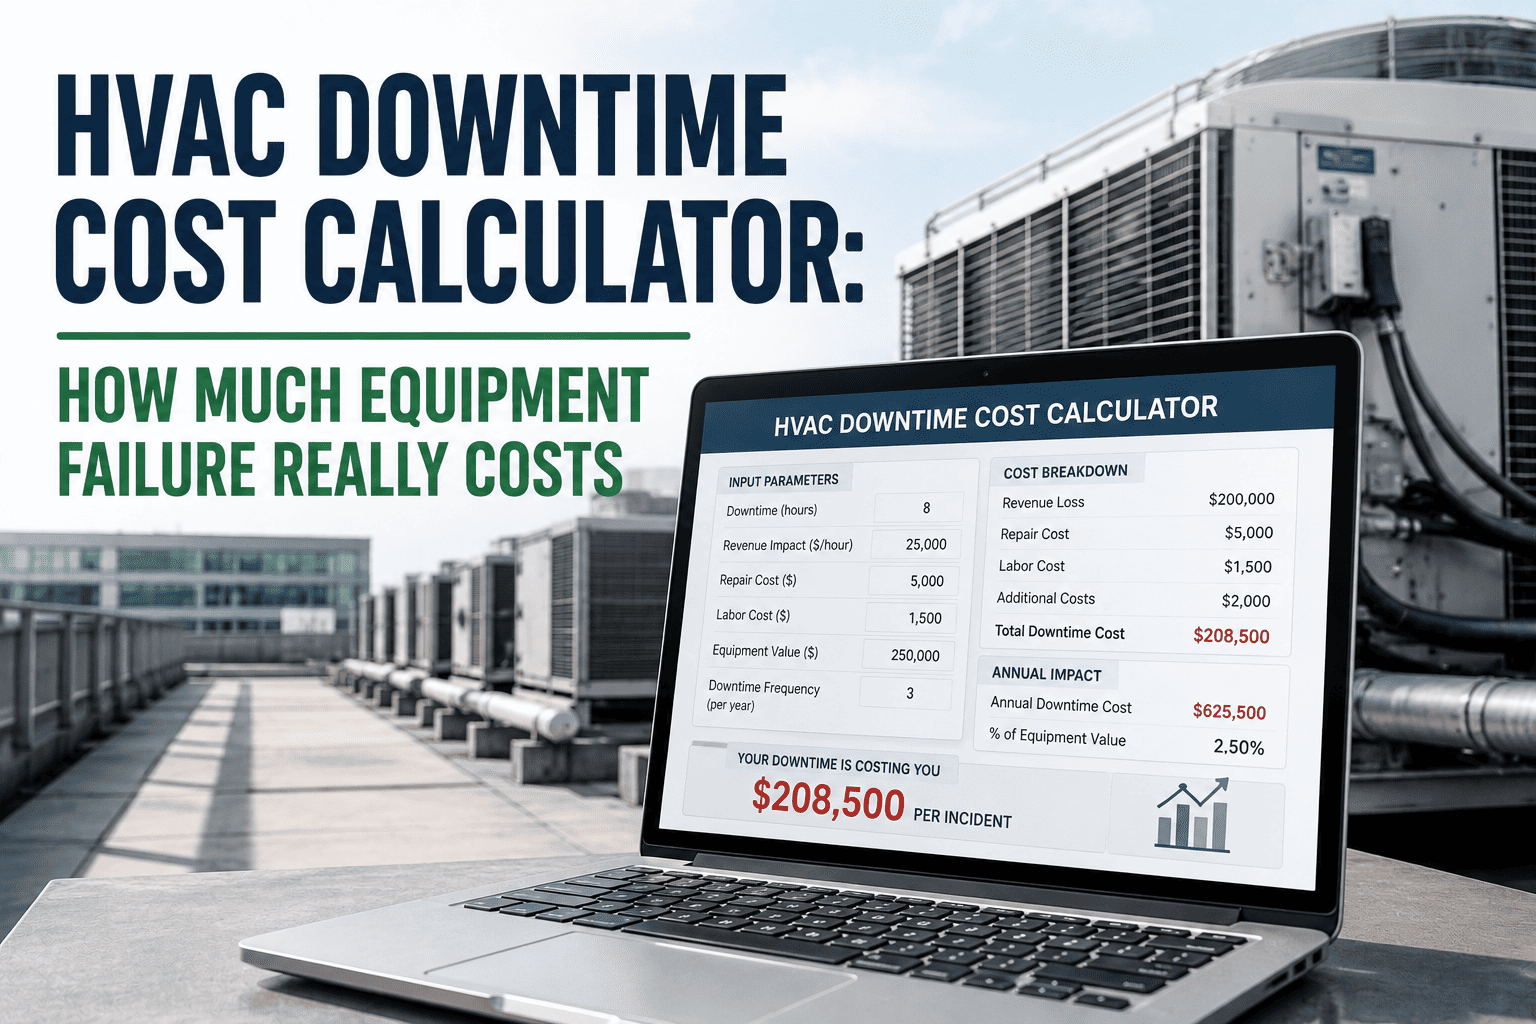
The HVAC Downtime Cost Formula
Before you can fix the problem, you have to size it. Use this framework to calculate what a single HVAC failure event actually costs your facility.
Downtime Cost Calculator: Office Building Example
This framework is based on documented outcomes from commercial facilities. Plug in your own building's numbers to estimate annual downtime exposure. Sign up free and OxMaint will help you track these costs per asset, not just per event.
What Drives HVAC Equipment Failure
Knowing where failures originate is the first step toward preventing them. These are the four root causes responsible for the majority of commercial HVAC downtime events.
Early Detection Windows: The Value of Time
The cost gap between early intervention and emergency repair is largest on high-criticality HVAC assets. These detection windows define how much time you have to act before a warning becomes a failure — and an affordable repair becomes an expensive crisis.
3 Signs Your Downtime Costs Are Out of Control
How OxMaint Cuts HVAC Downtime Cost
A predictive maintenance program is only as good as the data feeding it. OxMaint builds the asset history, condition records, and cost trends that predictive decisions require — without requiring sensor hardware on day one. Sign up free and start logging your first HVAC assets today.
Stop Paying for Failures You Could Have Prevented
OxMaint gives your facility team the asset history and condition data to catch HVAC failures weeks before they happen — and the reports to prove the ROI to leadership. No sensor hardware required to start.
Frequently Asked Questions
How much does HVAC downtime cost per hour?
It depends on facility type. For office buildings, a single downtime event typically costs $2,000–$15,000 when productivity loss and emergency labor are included. Data centers face costs of $300,000 or more per hour of cooling failure — Gartner research documents an industry average of $5,600 per minute for IT downtime driven by cooling failures. Hospitals face both financial and regulatory consequences. For any facility, the repair invoice is only the visible portion of total downtime cost. Sign up on OxMaint to start tracking real costs per asset.
What is the real cost of reactive HVAC maintenance?
Reactive maintenance typically costs 3–5x more than planned repair on the same fault. A chiller compressor bearing failure caught 3–6 weeks early costs $3,500–$8,000 to fix. Left undetected until failure: $18,000–$45,000. Across a full year for a large commercial building, reactive maintenance programs generate $35,000–$50,000 in avoidable emergency repair costs — not including energy penalties and shortened equipment lifespan. Book a demo to see the cost comparison against your own asset inventory.
Do I need IoT sensors to reduce HVAC downtime?
No. Sensor integration improves predictive capability, but the most impactful first step is building condition history in a CMMS. Logging inspection findings, repair events, and cost trends per asset over 12–24 months creates the baseline pattern data that surfaces failure trends before emergencies. OxMaint enables this without any sensor hardware — sensor data can be layered in as the program matures.
How quickly can a facility see ROI from predictive maintenance?
Research consistently documents payback periods of 4–8 months for commercial HVAC predictive maintenance programs. For a 200,000 sq ft office building, total annual benefit from emergency repair avoidance, energy savings, labor optimization, and deferred capital replacement ranges from $98,000–$188,000 against a platform cost of $30,000–$60,000 — a 160–520% ROI. McKinsey documents 10:1 to 30:1 ROI within 12–18 months for high-criticality assets.