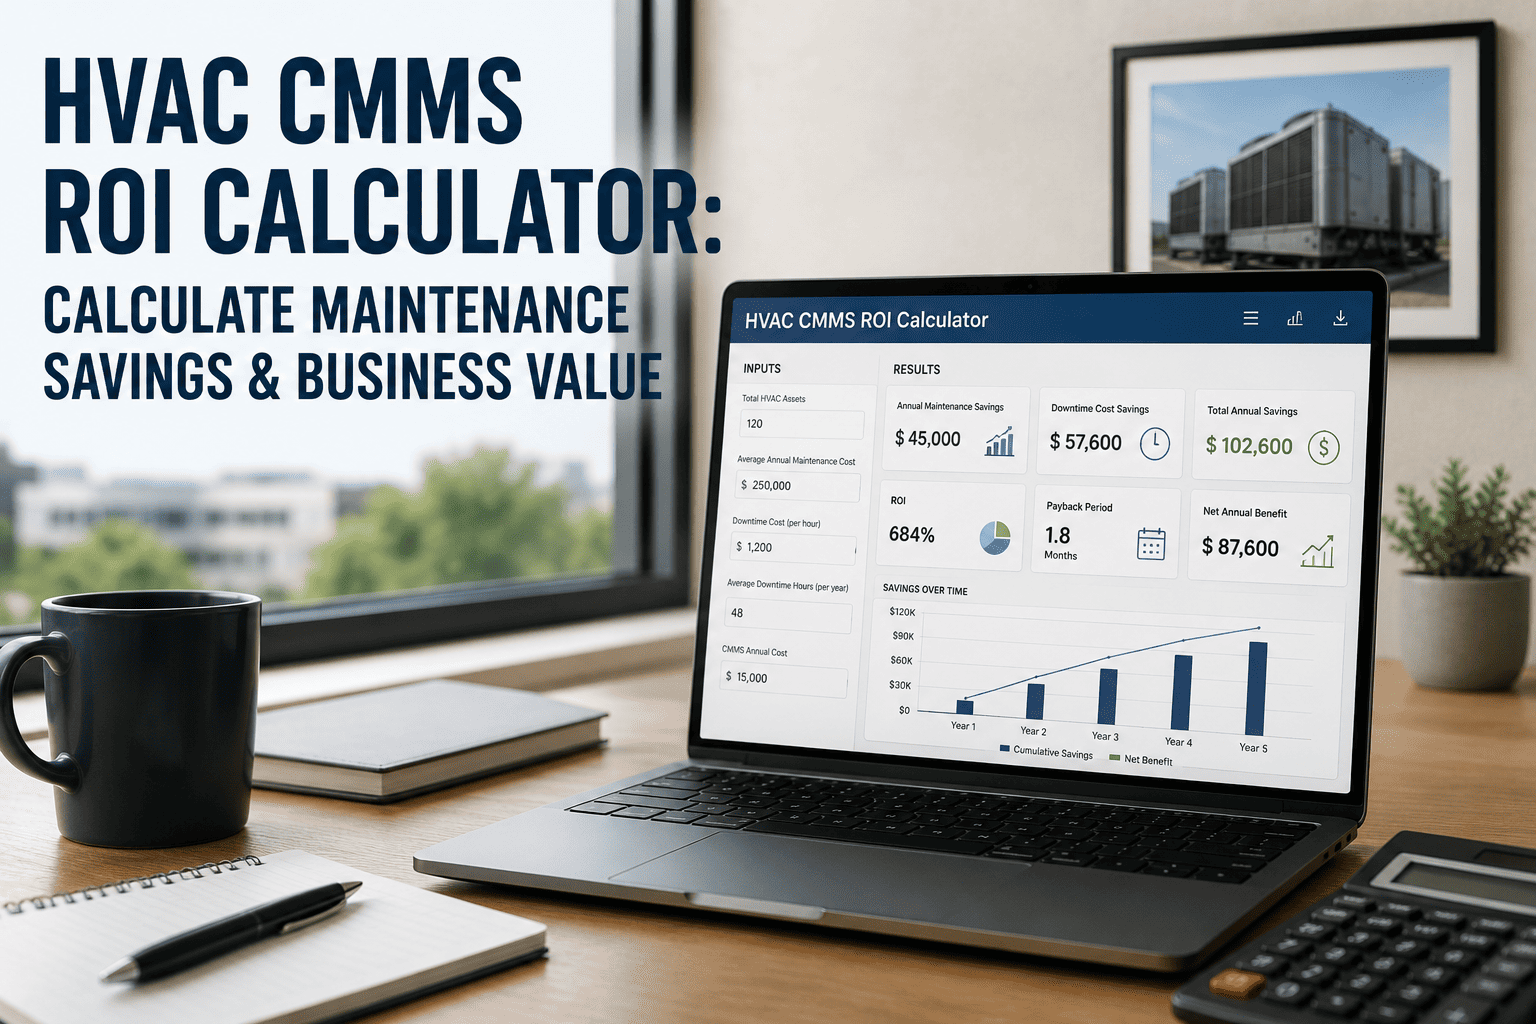
HVAC CMMS ROI Calculator: Calculate Maintenance Savings & Business Value
By Mark strong on June 9, 2026
Your finance director is not going to approve HVAC CMMS software based on "it will probably save money." They want a payback period, a year-one return, and a specific cost line being reduced. This guide gives you all three — plus a step-by-step calculator framework you can take directly into a budget meeting. Sign up free to start tracking your facility's baseline data today, or book a demo to get a site-specific ROI projection from the OxMaint team.
Stop Guessing. Start Calculating Your HVAC Savings.
OxMaint's Analytics Dashboard quantifies every saving stream — downtime, labor, energy, parts, and compliance — from day one of your free trial.
Why Most HVAC Maintenance Budgets Are Bleeding Money Invisibly
Organizations that track only direct labor and parts underestimate their true maintenance costs by 35–45%. Emergency contractor premiums, lost occupant productivity, compliance penalties, and accelerated asset degradation sit in budget lines nobody examines. Before you calculate ROI, you need to see where the hidden spend actually is. Sign up and let OxMaint surface those numbers from your own work order history.
Emergency Repair Premium
3–9x
Unplanned repairs cost 3 to 9 times more than the same job done as scheduled maintenance
Energy Waste from Deferred PM
20–40%
Degraded coils, fouled filters, and low refrigerant charge inflate energy draw before causing a visible failure
Technician Time on Non-Maintenance
34%
Without CMMS, technicians spend a third of every shift on phone calls, manual logging, and tracking parts
Emergency Parts Premium
2.4–3.2x
Spot procurement for the same part runs 2.4 to 3.2 times the planned procurement rate every time
The 5 ROI Streams Every HVAC CMMS Business Case Must Include
Most business cases fail because they only capture one or two categories. A complete CMMS ROI calculation covers five distinct streams — each measurable independently, each compounding the others. Book a demo to see how OxMaint quantifies all five for your specific facility.
01
Downtime Cost Reduction
Unplanned HVAC failures cost $1,200–$8,000 per event in commercial buildings when emergency call-out premiums, lost productivity, and occupant disruption are fully accounted. Structured PM programs cut event frequency by 35–50% within 12 months.
Mobile work order dispatch eliminates the 34% of shift time technicians waste on non-maintenance activities. CMMS-automated scheduling increases productive hours by 15–25% per technician — a direct reduction in labor cost per completed task.
Optimized PM schedules keep HVAC units running at design efficiency. For a facility spending $800,000 per year on energy, even the conservative 10% DOE estimate yields $80,000 in recoverable savings — without any capital investment in new equipment.
Benchmark reduction: 10–18% annual energy spend
04
Parts and Inventory Optimization
CMMS-based consumption tracking and minimum stock level management eliminates emergency procurement orders for 40–60% of repair events. Emergency spot procurement runs 2.4 to 3.2 times the planned rate — eliminating even half of those orders delivers immediate savings.
Equipment maintained at proper PM compliance intervals lasts 20–40% longer than reactively maintained assets. A 25% reduction in replacement frequency at 85%+ PM compliance defers significant capital expenditure that your finance team can quantify directly.
Get a Facility-Specific ROI Projection in 30 Minutes
Bring your annual maintenance spend, reactive work percentage, team size, and energy bill. OxMaint's team will produce a year-one savings model broken down by all five ROI categories.
Every credible CMMS business case uses the same fundamental equation. The variables are your own facility's data — the benchmarks below give you the reduction percentages to apply.
HVAC CMMS ROI Formula
ROI = (Total Annual Savings − Total CMMS Cost) / Total CMMS Cost × 100
Total Annual Savings =
Downtime Savings + Labor Gains + Energy Savings + Parts Savings + CapEx Deferral
Step 1
Downtime Savings
Count your unplanned HVAC events last year. Multiply by your average cost per event. Apply a conservative 35% reduction factor.
Take your annual maintenance payroll. Apply a 25% productivity improvement factor to get recoverable labor value.
Example: $320,000 payroll × 25% = $80,000/yr
Step 3
Energy Savings
Take your annual HVAC energy spend. Apply 10% (conservative DOE estimate) for structured PM improvement.
Example: $800,000 energy × 10% = $80,000/yr
Step 4
Parts Optimization
Take your emergency parts spend. Apply a 50% reduction from eliminating spot procurement orders.
Example: $45,000 emergency parts × 50% = $22,500/yr
Example Year-One Total Savings
$211,900
Across a mid-size commercial facility using conservative industry benchmarks — before CapEx deferral is included
Benchmark at a Glance: What HVAC CMMS Delivers
44%
Downtime
Reduction in unplanned downtime — facilities using CMMS vs. manual systems
18%
Energy
Annual energy savings across HVAC-heavy facilities with structured PM programs
25%
Labor
Increase in productive maintenance hours per technician after CMMS deployment
545%
Total ROI
Documented ROI from comprehensive preventive maintenance programs — every $1 saves $4–5
60–90
Days to Results
Most facilities see measurable results in reduced reactive volume within 60–90 days
40%
Asset Life
Longer equipment lifespan at 85%+ PM compliance — deferring major CapEx replacement
The Reactive vs. Preventive Ratio: The Single Most Important Number
Industry best practices target 70–80% preventive maintenance with only 20–30% reactive. Facilities that hit 80%+ planned ratios experience 40–50% lower total maintenance costs per square foot. Every reactive job converted to a scheduled job is money directly recovered. Sign up to track your planned-to-reactive ratio from day one.
Most Facilities Today
Reactive
65%
Preventive
35%
High Cost Mode
With CMMS
CMMS-Managed Facilities
Reactive
20%
Preventive
80%
40–50% Lower Cost/sqft
What OxMaint Tracks to Build Your ROI Case Automatically
Downtime Cost Dashboard
Every unplanned failure logged with asset ID, failure mode, response time, and occupancy impact — aggregated into a monthly downtime cost figure automatically
Labor Hour Split Reporting
Maintenance hours automatically split between planned PM, reactive response, and corrective work — enabling direct before/after cost comparison
PM Compliance vs. Failure Correlation
Dashboard plots PM completion rate against failure frequency by asset — showing directly whether your PM activity is producing measurable reliability outcomes
Asset Cost-of-Ownership Tracking
Total cost per asset from installation through every repair — when the replacement curve crosses the repair curve, you see it before an unexpected bill arrives
Compliance Audit Report Generation
Count the hours your team spends compiling maintenance reports manually. CMMS auto-generates every report from normal workflow data — zero additional labor required
Reactive-to-Planned Ratio Trending
Real-time reactive/preventive ratio tracking — when it trends upward, you know PM compliance is slipping before costs spike, not after
Six Inputs. One Boardroom-Ready ROI Model.
Bring your total maintenance spend, reactive work percentage, team size, loaded labor rates, HVAC energy spend, and weekly reporting hours. OxMaint turns those six numbers into a year-one savings projection by category — ready to present to your CFO.
All HVAC assets registered, current reactive work percentage established, PM schedule gaps identified
Days 14–30
First Labor and PM Savings Visible
Technician productive hours increase as mobile work orders replace phone calls and paper logs
Days 60–90
Measurable Downtime Reduction
Reduced reactive work volume and improved PM compliance rates become statistically visible in dashboards
Months 3–6
Energy Savings Appear in Utility Data
Consistent PM execution over seasonal cycles shows up as measurable utility bill reduction
Month 12
Full ROI Demonstrable Across All Five Streams
Year-one before/after comparison across maintenance cost, energy, and emergency repair frequency — statistically solid and CFO-ready
Frequently Asked Questions
What data do I need to start calculating HVAC CMMS ROI?
The minimum data set is: total annual maintenance spend, current reactive work percentage, number of maintenance staff and their loaded labor rates, annual energy spend on HVAC systems, and hours per week spent on manual reporting. With those five inputs, OxMaint can produce a site-specific ROI model showing year-one savings by category and payback period. Sign up free to start tracking your baseline metrics from day one.
How quickly does HVAC CMMS pay back its cost?
Most facilities see positive returns within 6–12 months. Measurable results in reduced reactive work volume and improved PM compliance typically appear within 60–90 days of implementation. Energy savings take 3–6 months to accumulate across seasonal cycles. The strongest business cases typically show 3x to 5x ROI over three years. Book a demo to get a facility-specific payback projection.
Is energy savings really worth calculating in the CMMS ROI model?
Yes — and it is often the most underappreciated stream. Degraded HVAC systems draw 20–40% more energy than properly maintained equipment before triggering any visible failure. For a facility with $800,000 in annual HVAC energy spend, a conservative 10% improvement from structured PM is $80,000 per year recovered without any capital investment. Studies show up to 18% savings across HVAC-heavy facilities with consistent PM programs.
Does asset life extension count as ROI?
Yes — and for many facilities it is the largest single ROI component, though the least visible in annual budget terms. Equipment maintained at proper PM compliance intervals lasts 20–40% longer than reactively maintained assets. A 25% reduction in replacement frequency defers significant capital expenditure that your finance team can model directly as avoided spend. Sign up and OxMaint tracks total cost of ownership per asset from day one.
What if we only have 5–10 technicians — is CMMS still worth it?
For HVAC-specific facilities with 5 or more technicians and critical equipment, positive ROI is typical even in year one. The labor productivity gains alone — recovering 25% of shift time spent on non-maintenance activity — often offset platform costs. Book a demo for a team-size-specific assessment before committing.
Free to Start — ROI Visible Within 90 Days
Every Dollar of Maintenance Spend. Tracked, Measured, Justified.
OxMaint gives HVAC and facilities teams the analytics infrastructure to calculate, prove, and continuously improve their maintenance ROI — with a dashboard built for the numbers your CFO actually cares about.