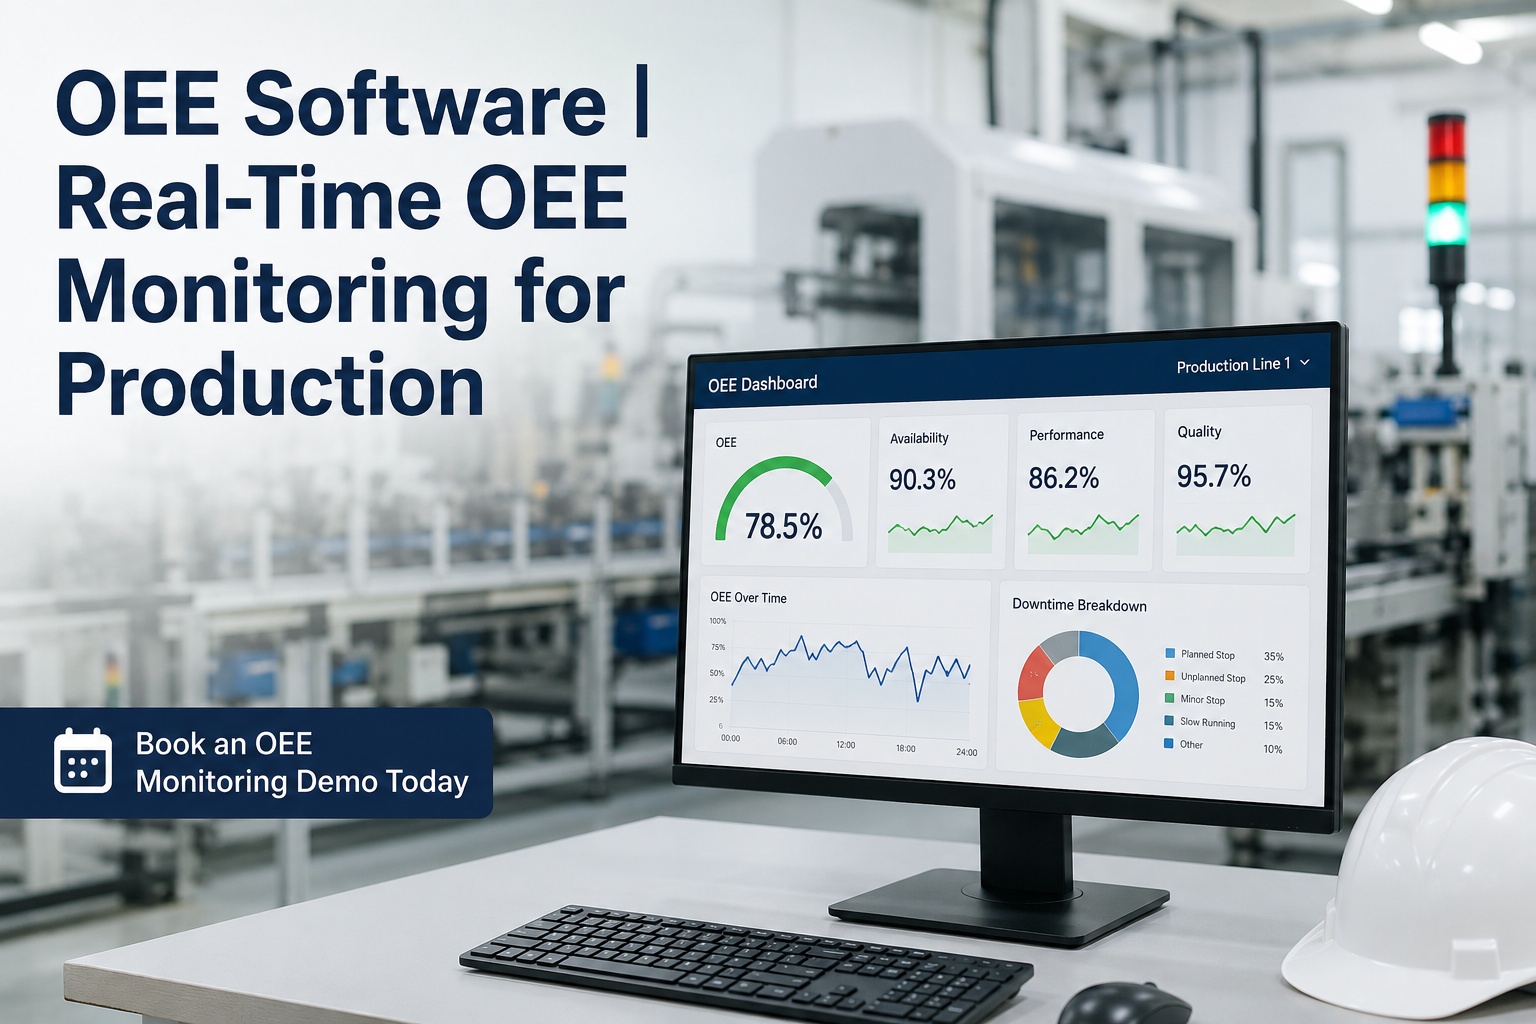
Ask a UK plant manager what their OEE is and you'll get a confident number. Measure it with real machine data and the answer is almost always 15-25 points lower. The Manufacturing Enterprise Solutions Association puts median discrete-manufacturing OEE at 60%. World-class sits at 85%. That 25-point gap isn't a maintenance problem — it's silent capacity leaking every shift. Real-time OEE monitoring closes it by showing exactly which of the six big losses is bleeding minutes right now. Oxmaint pulls live OEE from PLC and SCADA. Book a demo to see real-time OEE in action.
THE OEE FORMULA · WHY SMALL LOSSES COMPOUND
Availability × Performance × Quality = OEE
A
Availability
Run time ÷ planned production time
World-class: 90%
×
P
Performance
Actual output ÷ ideal output at design speed
World-class: 95%
×
Q
Quality
Good parts ÷ total parts produced
World-class: 99.9%
The compounding effect that catches most teams by surprise
90% × 90% × 99% = 80.2% OEE — not 93% as intuition suggests
Where the 25-Point Gap Actually Sits — The Six Big Losses
Nakajima's Six Big Losses framework, developed within Total Productive Maintenance, is still the definitive breakdown of where every point below 100% OEE actually goes. Every loss maps to one of the three OEE factors. The value of real-time monitoring isn't the headline score — it's knowing which of the six losses is dominating right now, so the intervention lands where the loss is happening.
AVAILABILITY LOSSES
01
Unplanned Stops
Breakdowns, equipment failures. Usually the biggest single availability loss.
02
Planned Stops
Setup, changeover, tooling adjustments. Compressible via SMED and standard work.
PERFORMANCE LOSSES
03
Small Stops
Micro-stops under 5 minutes — jams, sensor trips. Rarely logged manually.
04
Slow Cycles
Line running below design speed. Often hidden without real cycle-time data.
QUALITY LOSSES
05
Production Defects
Scrap and rework during steady-state production. Reflects process control.
06
Startup Rejects
Defects during warm-up, changeover, restart. Concentrated but often invisible.
Small stops and slow cycles are the losses paper systems consistently miss — operators don't log a 90-second sensor trip. Real-time PLC data does. Sign up free to see where your losses actually sit.
The 60% vs 85% Gap — What Recovering Even Half of It Actually Means
The gap between the industry median (60% OEE) and world-class (85%) represents roughly 41% more output from the same equipment, the same headcount and the same shifts. That's not incremental — it's the equivalent of adding capacity without capex. For most UK production lines, a 10-point OEE improvement recovers £50,000-£200,000 per line per year in reclaimed capacity. The visual below shows what that gap actually looks like when you split it by loss category.
Only 6% of plants achieve this
+41%
More output moving from 60% → 85% OEE
£50-200k
Per line per year from a 10-point OEE gain
6%
Of manufacturers globally hit world-class OEE
Live Shift-by-Shift OEE — What the Dashboard Actually Shows
Monthly OEE reports are how the metric fails in practice — the data is a month stale by the time anyone reviews it, and the underlying shift that caused the loss is long gone. Real-time OEE tracks the score as it happens, per line, per shift, per product changeover, and shows exactly which of the six losses is dominating right now. The mockup below is the shape of the OEE view Oxmaint delivers.
Live OEE · Line 3 · Current Shift (14:00-22:00)
▲ Auto-refresh · 5s
72.4%
Current OEE
▲ 4.2pp vs last shift
Top Losses This Shift · Ranked by Minutes
SMALL STOP
Reject sensor false-trip · Station 4
18 min
SLOW CYCLE
Filler running 92% of design speed
14 min
UNPLANNED
Capper jam · WO #4472 raised
9 min
See Real-Time OEE on Your Production Lines
Walk through live shift-by-shift OEE dashboards, PLC and SCADA integration via OPC-UA and MODBUS, six-losses categorisation, automatic work-order creation on unplanned stops, and product-changeover analysis — configured against your actual production lines. Thirty minutes with the Oxmaint team.
Expert Perspective — Why Most OEE Programmes Overstate the Score
"
The number you get from operators writing OEE on a shift log is not the same number you get from PLC data. It's routinely 15-25 points higher. Operators forget the 90-second micro-stops, round the changeover minutes down, and set the ideal cycle time to whatever the line currently averages rather than what the nameplate says. The gap between "logged OEE" and "actual OEE" is where the improvement opportunity hides. Sites that switch to machine-captured OEE are almost always shocked by the first honest number — and then relieved, because now they know where the losses actually sit. The 25-point improvement journey doesn't start with a target; it starts with a truthful baseline.
01
Machine-captured, not logged
OEE pulled directly from PLC/SCADA — no operator estimation, no rounding, no forgotten micro-stops.
02
Ideal cycle at nameplate
Performance calculated against design speed, not observed average. Nameplate stays honest.
03
Losses auto-categorised
Every downtime event tagged to one of the six losses. Root cause visible without spreadsheet analysis.
04
Losses become work orders
Unplanned stops auto-generate WOs. Recurring loss patterns escalate to reliability review.
Where Real-Time OEE Actually Changes What Teams Do
The value of live OEE isn't the dashboard — it's the intervention it enables. A supervisor seeing Line 3 drop to 68% availability at 15:20 can walk over and reset the sensor that's false-tripping before shift end, not review it in next month's report. A continuous improvement team seeing "small stops" as the dominant loss category all week can target one specific station rather than launching a plant-wide TPM initiative. A maintenance manager seeing recurring unplanned stops on a specific asset can promote it into the condition-monitoring programme. Every one of these decisions gets faster and more accurate when the OEE data is real-time rather than monthly. Sign up free to give your team real-time loss visibility.
Who Uses Oxmaint for Real-Time OEE
The platform is used across UK operational roles that own production performance: operations managers tracking shift-by-shift OEE against monthly targets, plant managers benchmarking line performance across sites, production supervisors intervening on losses during the shift rather than reviewing them next month, continuous improvement teams targeting specific loss categories with SMED and TPM initiatives, maintenance managers using availability loss data to prioritise reliability programmes, quality managers linking OEE quality-factor drops to specific process events, and finance teams quantifying reclaimed capacity against capex avoidance. Each role sees the same OEE data filtered to their view — live shift dashboard, cross-line benchmark, loss trend or cost-of-loss dashboard. Sign up free to configure OEE views for your team.
Getting Real-Time OEE Live
Deployment starts with connecting to your existing PLC and SCADA infrastructure — most UK plants already have Siemens, Rockwell, Allen-Bradley or Mitsubishi PLCs producing the data OEE calculations need. Oxmaint's integration layer supports OPC-UA, MODBUS TCP and direct historian APIs. Line configuration establishes ideal cycle time per product (nameplate speed), acceptable changeover windows and quality data source (in-line inspection or downstream defect capture). The six-losses taxonomy configures per site with your own downtime reason codes. Most sites see live OEE dashboards inside 30 days on primary production lines; the full loss-to-work-order automation and cross-line benchmarking typically inside 60. Book a walkthrough to see live UK OEE deployments.
Turn OEE From Monthly Report Into Real-Time Operational Lever
Oxmaint gives operations, maintenance and continuous improvement teams one platform for live PLC-captured OEE, six-losses categorisation, shift-by-shift dashboards and automatic work orders on unplanned stops — built to close the 60%-to-85% gap on UK production lines.
Frequently Asked Questions
What is OEE and why does UK manufacturing use it?
OEE (Overall Equipment Effectiveness) is the gold-standard KPI for measuring manufacturing productivity — the percentage of planned production time that is truly productive. It combines three factors: Availability (uptime losses), Performance (speed losses) and Quality (defect losses). Developed by Seiichi Nakajima as part of Total Productive Maintenance in the 1980s, it's used across UK automotive, food and beverage, pharmaceuticals, packaging and general discrete manufacturing to identify where production capacity is being lost and to prioritise improvement effort. The Manufacturing Enterprise Solutions Association reports median discrete-manufacturing OEE at 60% — leaving significant reclaimable capacity in most plants.
What is a good OEE score?
World-class OEE for discrete manufacturing is 85% — the benchmark set by Nakajima, corresponding to 90% Availability × 95% Performance × 99.9% Quality. Industry median is around 60%; anything below 40% signals significant unaddressed losses. Only about 6% of manufacturers globally reach the 85% threshold. Industry variation matters: automotive assembly targets 85-92% world-class, food processing 75-85%, pharmaceuticals 70-80%. The most useful benchmark is not the industry average but your own trend — consistent upward movement means improvement initiatives are working, regardless of the absolute number.
Can OEE integrate with our existing PLC and SCADA?
Yes. Most UK plants already have PLCs (Siemens, Rockwell, Allen-Bradley, Mitsubishi, Schneider) and SCADA systems producing the machine-state, cycle-count and reject-count data OEE calculations need. Oxmaint's integration layer supports OPC-UA (the modern industrial standard), MODBUS TCP and direct APIs to major historian platforms (OSIsoft PI, AVEVA, GE Proficy). Configuration establishes ideal cycle time per product, changeover windows and quality data source. The advantage of machine-captured OEE over manual logging is honesty — micro-stops get counted, ideal speed stays anchored to nameplate, and the resulting score reflects genuine performance rather than operator estimation.
What are the Six Big Losses?
The Six Big Losses is Nakajima's structured framework for categorising every minute of productive time lost, mapped directly to OEE's three factors. Availability losses: unplanned stops (breakdowns) and planned stops (setup/changeover). Performance losses: small stops (micro-stops under 5 minutes) and slow cycles (running below design speed). Quality losses: production defects (steady-state scrap and rework) and startup rejects (defects during warm-up or changeover). Real-time OEE monitoring auto-categorises every downtime event against this framework — visible without spreadsheet analysis and available shift-by-shift rather than month-by-month.
How quickly can real-time OEE deliver measurable improvement?
Documented deployments across UK and European manufacturing typically show 10-15% OEE improvement in the first 3-6 months — driven by loss-visibility alone, before any structured improvement programme kicks in. Simply seeing the true baseline usually reveals losses (particularly small stops and slow cycles) that weren't being logged manually. Phase 2 gains — from targeted improvement programmes, condition-based maintenance and standard-work discipline — typically follow in months 6-18. For a UK line generating £2-5m annual output, a 10-point OEE gain often recovers £50,000-£200,000 per year in reclaimed capacity without additional headcount or capital investment.