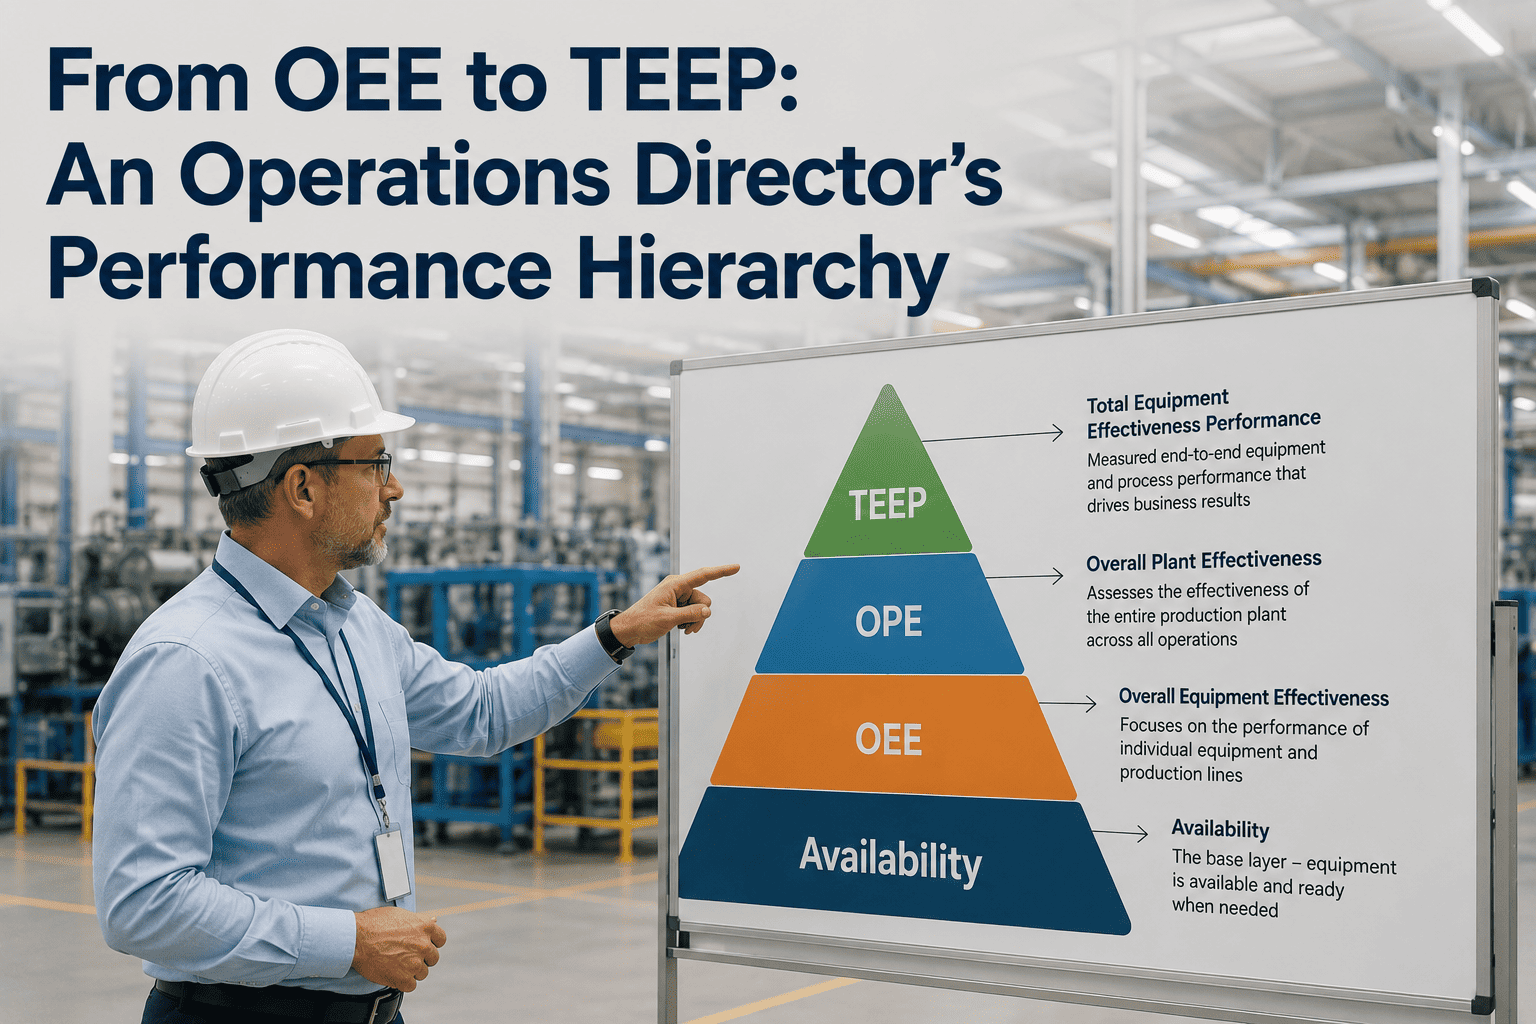
A plant can post 85% OEE — a genuinely world-class number — and still only be using 20% of the hours on the calendar. Both figures are correct. Neither one is the full picture. An operations director who only tracks OEE will never see the case for adding a shift, and one who only tracks capacity will never know why the shift they already have is underperforming. The performance hierarchy — OEE, NEE, OOE, and TEEP — exists to answer three different investment questions with three different numbers.
See OEE and TEEP Side By Side, Automatically
One dashboard tracking scheduled-time performance and total-calendar capacity — so the investment question answers itself.
OEE and TEEP Answer Different Questions
OEE measures Availability, Performance, and Quality against scheduled production time — it tells you how well your team ran the hours they were given. TEEP multiplies that same OEE by Utilization, the share of all 8,760 yearly hours actually scheduled for production — it tells you how much of the calendar is sitting idle.
The Performance Hierarchy
OEE
Scheduled production time only. Answers: is my team running the shift well right now?
NEE
Same window as OEE, minus setup and changeover from the downtime count. Answers: how well does the process run once it's running?
OOE
All operating time, including planned downtime and idle periods. Answers: how well is the wider operation using the time it controls?
TEEP
Full calendar time, 24 hours a day, 365 days a year. Answers: how much untapped capacity exists before I need new assets?
Four Metrics, Four Owners
| Metric | Time Base | Question It Answers | Typically Owned By |
|---|---|---|---|
| OEE | Scheduled production time | Is the shift running well? | Shift supervisor, line manager |
| NEE | Scheduled time, changeovers excluded | How clean is the process itself? | Process engineer |
| OOE | All operating time | Is planned downtime justified? | Plant manager |
| TEEP | Full calendar time (168 hr/week) | Do we need more capacity, or less? | Operations director, CFO |
Three Decisions The Hierarchy Drives
Invest In Capacity
High OEE and high TEEP together mean the line is already close to its ceiling — a new asset is the only way to grow further.
Sweat The Asset Harder
Low OEE with low TEEP means the equipment isn't the constraint — the existing shift has fixable losses before anything new is needed.
Add A Shift
High OEE with low TEEP is the classic case for a second or third shift — the crew you have is proving the process works.
Sell The Spare Capacity
Sustained low TEEP on a well-run asset is unused capital — a candidate for contract manufacturing or a line consolidation review.
Turn Four Metrics Into One Capital Decision
OEE, NEE, OOE, and TEEP tracked from the same downtime and output data — no separate spreadsheets to reconcile.
Why Most Plants Only See Half This Picture
OEE is tracked almost everywhere, because it lives inside the shift and the shift supervisor owns it. TEEP rarely gets tracked at all, because it requires calendar-time data that manual OEE logs were never built to hold. That gap is exactly why a well-run line can hide a capacity problem for years — the OEE dashboard looks fine, so nobody asks the utilization question.
Sign up free to see OEE, OOE, and TEEP calculated from the same live data instead of three separate reports built on three separate assumptions.
How OxMaint Supports the Full Hierarchy
Automated OEE Tracking
Availability, Performance, and Quality are captured live per asset, shift, and line, without manual entry.
Calendar-Time Utilization
Scheduled hours are tracked against the full 168-hour week, giving TEEP without a separate manual calculation.
Downtime Reason Coding
Changeover, planned maintenance, and unplanned stops are separated out, feeding OEE, NEE, and OOE from one dataset.
Capacity Reporting for Leadership
A single view lets operations directors present the invest, sweat, or sell-capacity case with numbers everyone trusts.
Frequently Asked Questions
Is TEEP just OEE for the whole year?
Not quite — TEEP is OEE multiplied by Utilization, the share of total calendar time that is actually scheduled for production, so it captures shifts never worked as well as losses within the shifts that were.
What is NEE and how is it different from OEE?
NEE uses the same scheduled-time window as OEE but excludes setup and changeover from the downtime calculation, isolating how well the process runs once it is actually running.
Why would a plant with excellent OEE still need more capacity investment?
High OEE only proves the scheduled hours are used well — if those hours are a small fraction of the calendar, TEEP will still be low and additional shifts or lines may be the only way to grow output.
Should every plant calculate TEEP?
TEEP matters most when a capacity or capital decision is on the table; plants without near-term expansion or consolidation questions can often run on OEE alone.
Who should own TEEP inside an operations team?
TEEP is typically an operations director or finance-facing metric, since it feeds capital allocation decisions rather than day-to-day shift management.
Ready To See Where Your Real Capacity Sits
Connect your lines once and get OEE, NEE, OOE, and TEEP on a single live dashboard built for capital decisions.







