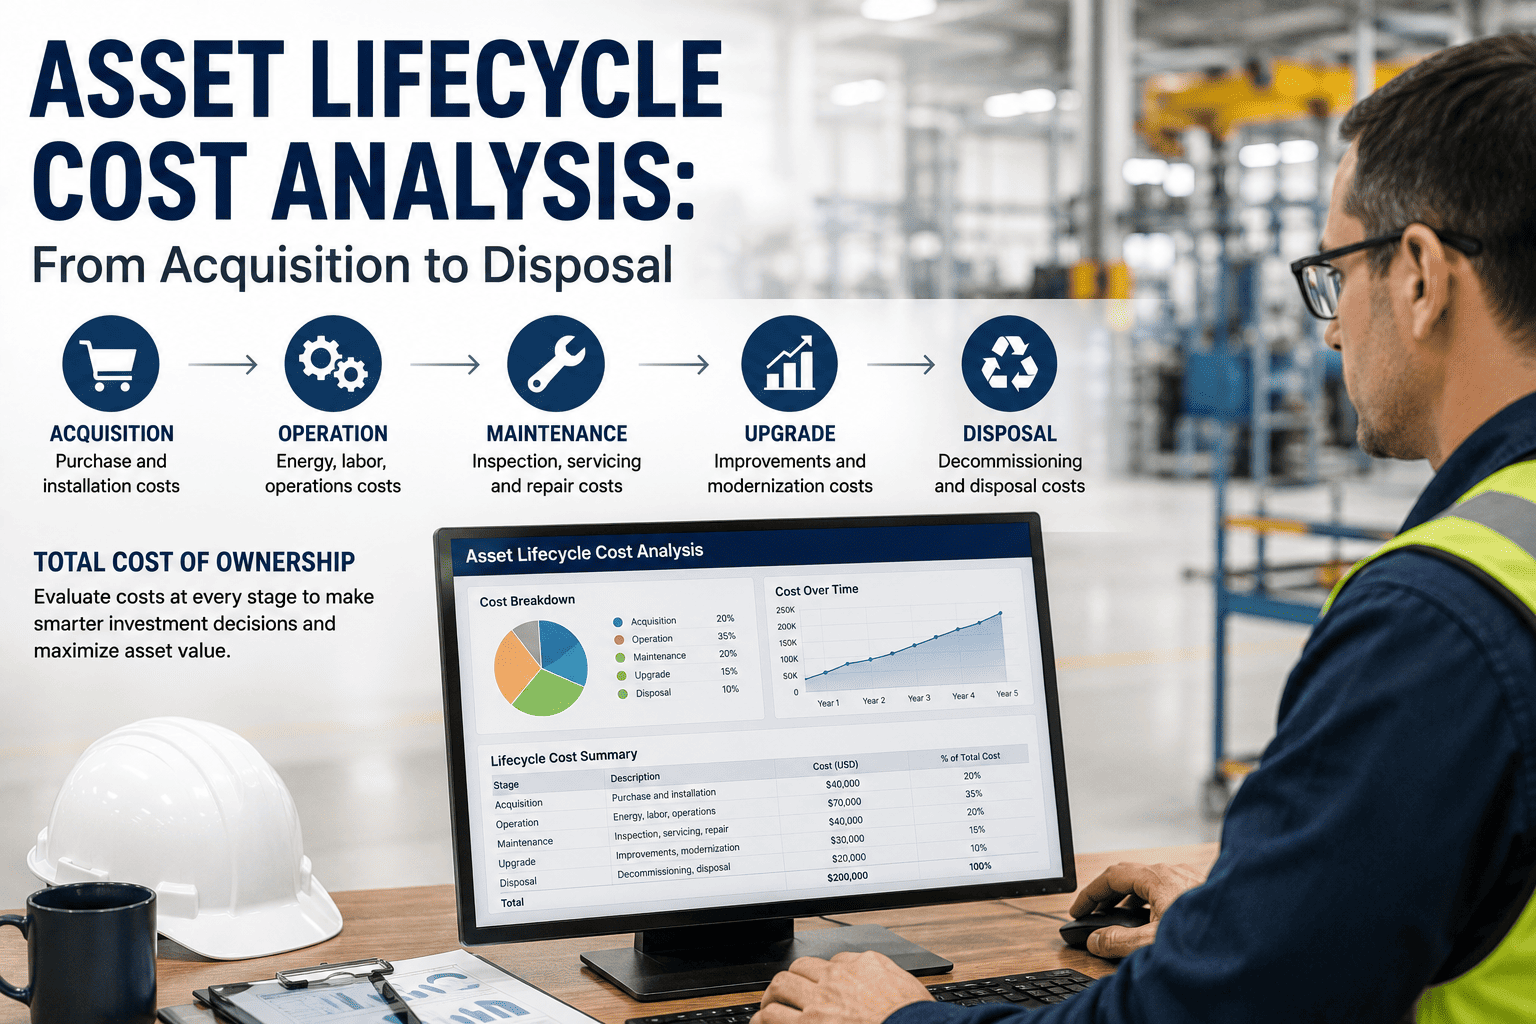
When a finance team approves the purchase of a new chiller, pump, or conveyor line, they approve a number on a quote. What they do not see is that this number represents roughly 20 to 25 percent of what that asset will actually cost the organization before it is decommissioned. The other 75 to 80 percent — energy consumed over a decade of operation, maintenance work orders that accumulate every quarter, production lost during unplanned failures, mid-life upgrades to meet regulatory changes, and eventually the cost of safe disposal — never appears in the original procurement decision. Asset lifecycle cost analysis is the discipline that makes all of it visible, before the spending happens rather than long after. Sign up free on OxMaint to build per-asset cost records from your work orders, or book a demo to see how lifecycle cost data changes capital planning conversations.
Your Work Orders Are Lifecycle Cost Data — OxMaint Makes Them Visible
Every closed work order in OxMaint logs labor, parts, and total cost against the asset that generated it — automatically building the cumulative maintenance cost record that makes lifecycle analysis, repair-vs-replace decisions, and capital planning defensible.
Why Purchase Price Is the Wrong Number to Optimize
The most common mistake in capital procurement is treating acquisition cost as the primary decision variable. It is the most visible number, but it is the smallest one. For most industrial and commercial equipment, the purchase price represents a minority of what the asset will cost over its useful life. Optimizing that number alone — choosing the cheaper of two options based on purchase price — regularly produces the more expensive long-term outcome.
What you see at procurement
Acquisition Cost
75–80% hidden at purchase
What actually accumulates
Acq.
Operations & Energy
Maintenance
Down.
Acquisition 20–25%
Operations & Energy 30–40%
Maintenance 25–35%
Downtime 8–12%
Disposal 2–5%
The Complete Lifecycle Cost Model: Every Category Defined
A complete lifecycle cost analysis captures every cost category from initial procurement through end-of-life disposal. Each category requires different data sources and different estimation methods — but all of them must appear in the model for the analysis to be accurate and actionable. Sign up on OxMaint to centralize the maintenance cost data that forms the largest controllable portion of your lifecycle cost model.
Purchase price
The visible cost — but not the only acquisition cost. Vendor margin, financing charges, and contract terms all affect the true purchase cost beyond the quoted price.
Freight, handling, and import costs
Often underestimated for large or imported equipment. For specialist machinery, freight can represent 3–8% of purchase price.
Site preparation and infrastructure
Civil works, electrical supply upgrades, structural modifications — costs that belong to the asset but rarely appear in the asset's budget line.
Installation and commissioning
Labor, specialist contractor fees, testing, calibration, and the cost of production disruption during installation.
Initial spares and documentation
OEM-recommended initial spare parts package, technical documentation, and training for operating and maintenance staff.
Common procurement error: Choosing on purchase price alone ignores the 75–80% of total lifecycle cost that follows. A lower-priced asset with higher energy consumption or lower reliability regularly costs more over 10 years than the alternative.
Energy and utilities consumption
For motors, compressors, HVAC, and process equipment, energy cost over a 10–15 year asset life frequently exceeds the original purchase price — making energy efficiency a primary lifecycle cost factor, not a secondary specification.
Efficiency degradation cost
Aging assets consume more energy per unit of output than at commissioning. This degradation compounds annually and is rarely tracked unless asset-level energy monitoring is in place.
Consumables and process materials
Lubricants, filters, process chemicals, and other consumables that are consumed in operation — distinct from maintenance parts.
Insurance and compliance costs
Annual insurance premiums, inspection fees, certification renewals, and regulatory compliance costs allocated to the asset over its operational life.
Energy is the most underestimated lifecycle cost category at procurement. For HVAC, pumps, and motors, specifying a higher-efficiency unit at a higher purchase price typically produces a lower LCC — but only if the energy cost is modeled over the full asset life.
Scheduled preventive maintenance
Labor hours and rate per PM visit, parts and consumables consumed at service, and specialist contractor fees for manufacturer-required servicing.
Reactive and corrective repairs
Unplanned repair labor and parts — typically carrying a higher unit cost than planned maintenance due to emergency call-out rates and non-contract parts sourcing.
Inspection and condition monitoring
Vibration analysis, thermographic surveys, oil analysis, and other condition monitoring costs that enable predictive intervention.
Spare parts inventory holding
The working capital tied up in spare parts specific to the asset — a real cost of ownership that standard lifecycle models often exclude.
Maintenance cost is the most controllable lifecycle cost category — and the most data-rich when a CMMS is in use. Per-asset work order history is the foundation of every repair-vs-replace decision and every capital replacement business case.
Production loss per unplanned failure
For assets on the critical production path, each hour of unplanned downtime carries a production loss cost that is frequently the largest single cost event in the asset's life. Quantifying this at the asset level is what converts downtime from an operational metric into a financial one.
Idle labor during stoppage
Operators, downstream process workers, and logistics teams whose productivity is impaired by the asset failure — often excluded from downtime cost estimates but consistently present.
Consequential costs
Customer penalties, expedited freight to recover schedule, scrap from interrupted processes, and reputational cost where relevant to the asset's function.
Downtime cost is the most commonly underestimated lifecycle cost category — particularly for assets on critical production paths. Including it in the lifecycle model is what makes the financial case for predictive maintenance investment, not just the reliability case.
Technology and control system upgrades
Software updates, PLC replacements, and control system modernization to maintain compatibility and capability over the asset's operating life.
Regulatory compliance retrofits
Modifications required by changing safety standards, environmental regulations, or refrigerant phase-down requirements — costs that were not foreseeable at procurement but are real lifecycle costs.
Major component overhauls
Compressor overhauls, gearbox rebuilds, heat exchanger replacements — capital-level interventions that extend asset life but represent significant mid-life investment.
Mid-life investment decisions are where lifecycle cost analysis earns its value. The overhaul vs. replace decision requires the full cost model — not just the overhaul quote compared to a replacement quote — to determine which option produces better long-term value.
Safe decommissioning and disconnection
Electrical disconnection, fluid recovery, pipework removal, and specialist contractor costs for assets containing hazardous materials.
Environmental compliance and remediation
Refrigerant recovery and reclaim, oil and chemical disposal, asbestos-containing material removal, and site remediation where contamination exists.
Residual value or scrap recovery
Where an asset has resale or scrap value at end of life, this offsets disposal cost. The timing of disposal relative to the depreciation curve significantly affects net disposal cost.
Disposal cost is routinely excluded from procurement decisions and capital planning. For assets with refrigerants, hydraulics, embedded electronics, or hazardous materials, disposal can be a material cost that should appear in the original acquisition budget.
The LCC Formula and How to Apply It
The lifecycle cost formula is simple. Getting accurate inputs is the real challenge — and the reason that organizations with per-asset cost tracking in their CMMS consistently produce better lifecycle analysis than those running the same calculation on estimates. Book a demo to see how OxMaint feeds real maintenance cost data into this model automatically.
The Repair vs. Replace Decision: Where LCC Creates the Most Immediate Value
The repair-vs-replace decision is the most common point at which lifecycle cost analysis produces measurable financial impact. Most organizations make this decision based on the current repair quote alone — without any view of cumulative maintenance history or projected remaining life costs. The result is a systematic bias toward repair, even when replacement is the better economic choice. Sign up free on OxMaint to access the per-asset cost history that makes this decision financially defensible.
Repair — when these are true
Under 30%
Repair cost as a percentage of current replacement value
Under 70%
Asset age as a percentage of design life — substantial economic life remaining
Stable
Annual maintenance cost trend — no evidence of accelerating failure rate
Available
OEM parts and manufacturer support — standard lead times and costs
Replace — when these are true
Over 50%
Repair cost as a percentage of replacement value — further investment locks in a declining asset
Rising
Annual maintenance cost trend — wear-out curve pattern with increasing failure frequency
Significant
Energy efficiency gap versus new equivalent — replacement recovers cost through energy savings alone
Obsolete
Parts availability or OEM support — extended lead times or discontinued product support increasing reliability risk
The 50% Rule: When a repair quote exceeds 50% of current replacement value on an asset past two-thirds of its design life, replace. The remaining useful life does not justify the investment, and the lifecycle cost model will confirm it.
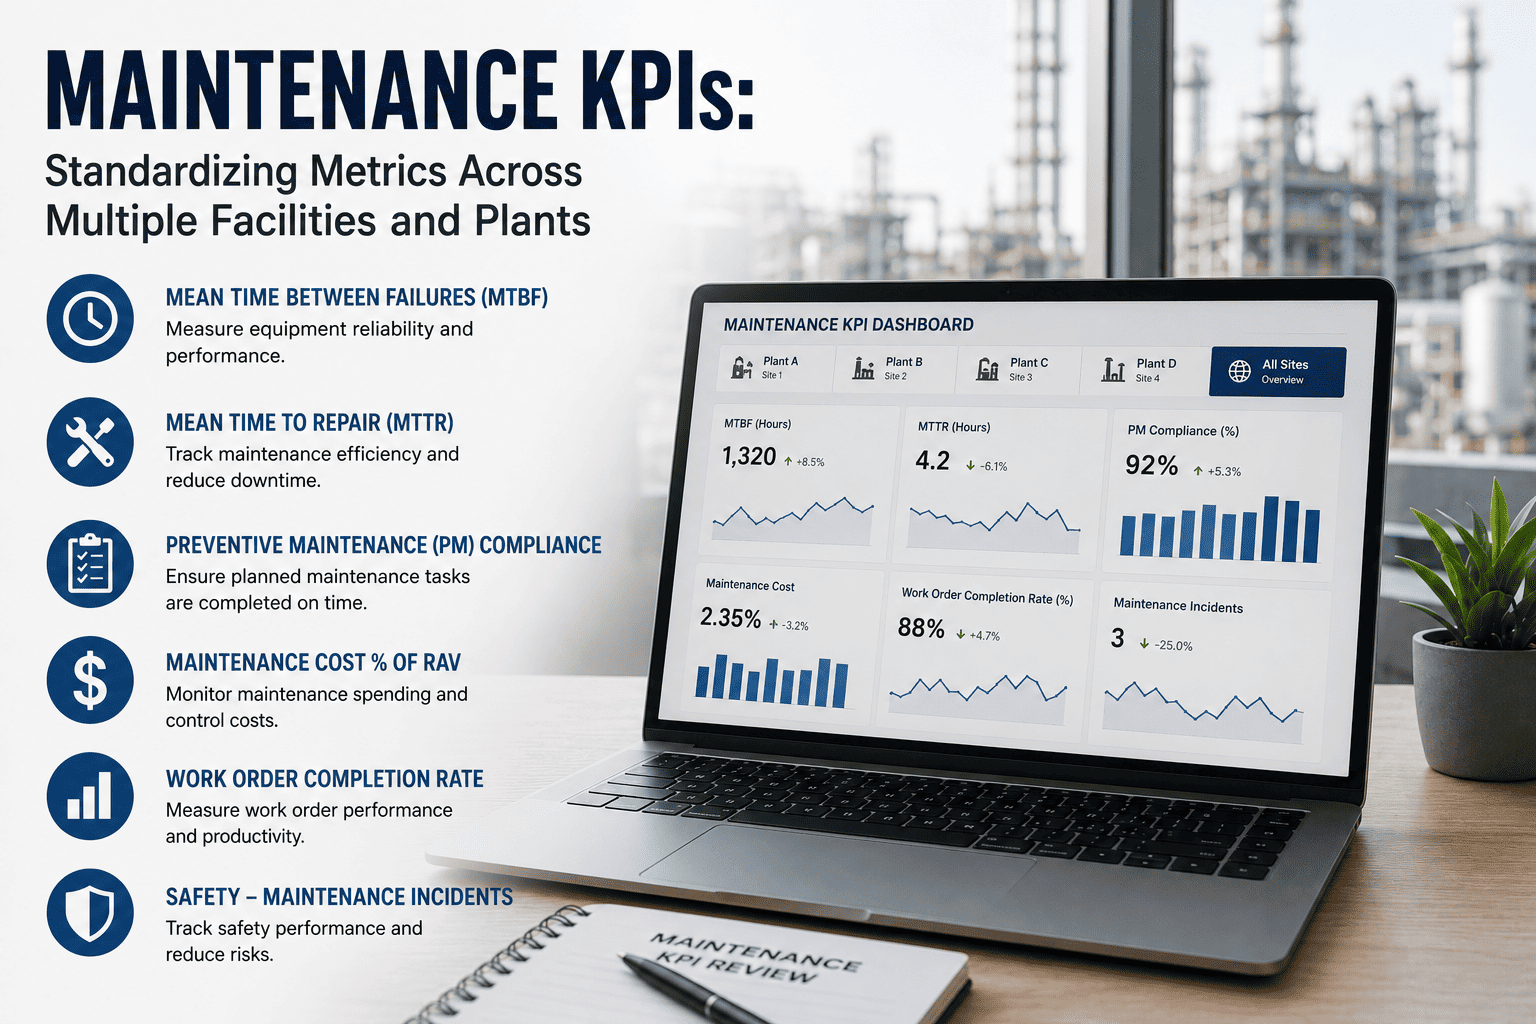
Key Metrics Derived from Lifecycle Cost Analysis
Four metrics translate lifecycle cost data into the numbers that capital planners, maintenance managers, and finance teams use to make replacement decisions and build budget cases. Book a demo to see how OxMaint generates these metrics from your maintenance records.
FCI
Facility Condition Index
Deferred Maintenance ÷ Current Replacement Value
Under 0.05 — Good condition
0.05–0.10 — Fair — monitor
Over 0.10 — Poor — replacement may be more economic than continued maintenance
MCR
Maintenance Cost Ratio
Annual Maintenance Cost ÷ Current Replacement Value × 100
Under 5% — Healthy — asset in productive life
5–10% — Monitor trend — watch for acceleration
Over 10–15% — End-of-life zone — replacement assessment required
EUAC
Equivalent Uniform Annual Cost
(Total LCC − Residual Value) ÷ Asset Life in Years
Normalizes LCC to an annual cost — enables direct comparison between assets with different lifespans or purchase prices on an equal annual-cost basis
CORC
Cost of Reactive vs Controlled
Reactive Maintenance Cost ÷ Total Maintenance Cost × 100
Under 20% — Proactive operation
20–40% — Mixed — room for PM improvement
Over 40% — Reactive-dominant — highest lifecycle cost profile
Building the Data Foundation: What You Need and Where to Get It
Lifecycle cost analysis is only as reliable as the data that feeds it. The most common failure in LCCA programs is not the model — it is missing or incomplete cost data that forces estimation rather than calculation. Sign up free on OxMaint to start building the per-asset cost records that make lifecycle analysis accurate rather than approximate.
Acquisition
Purchase price, installation, commissioning cost
Capital project records, asset register
Site preparation and infrastructure costs excluded from the asset's cost record
Maintenance
Labor hours, parts cost, repair frequency per asset
CMMS / work order records
Costs allocated to cost centres, not asset IDs — making per-asset aggregation impossible without manual reconstruction
Energy
Annual kWh or fuel consumption per asset
Sub-metering, BMS, utility bills
No asset-level sub-metering — energy allocated by area or building, not by individual asset
Downtime
Downtime hours per failure event + production loss rate per hour
Work orders + production / operations systems
Downtime hours recorded but not converted to financial cost — no agreed production loss rate per hour per asset or system
Disposal
Decommissioning cost, environmental compliance, scrap value
Contractor quotes, environmental records
Rarely estimated at acquisition — typically discovered at end of life, which is too late for it to inform the original purchase decision
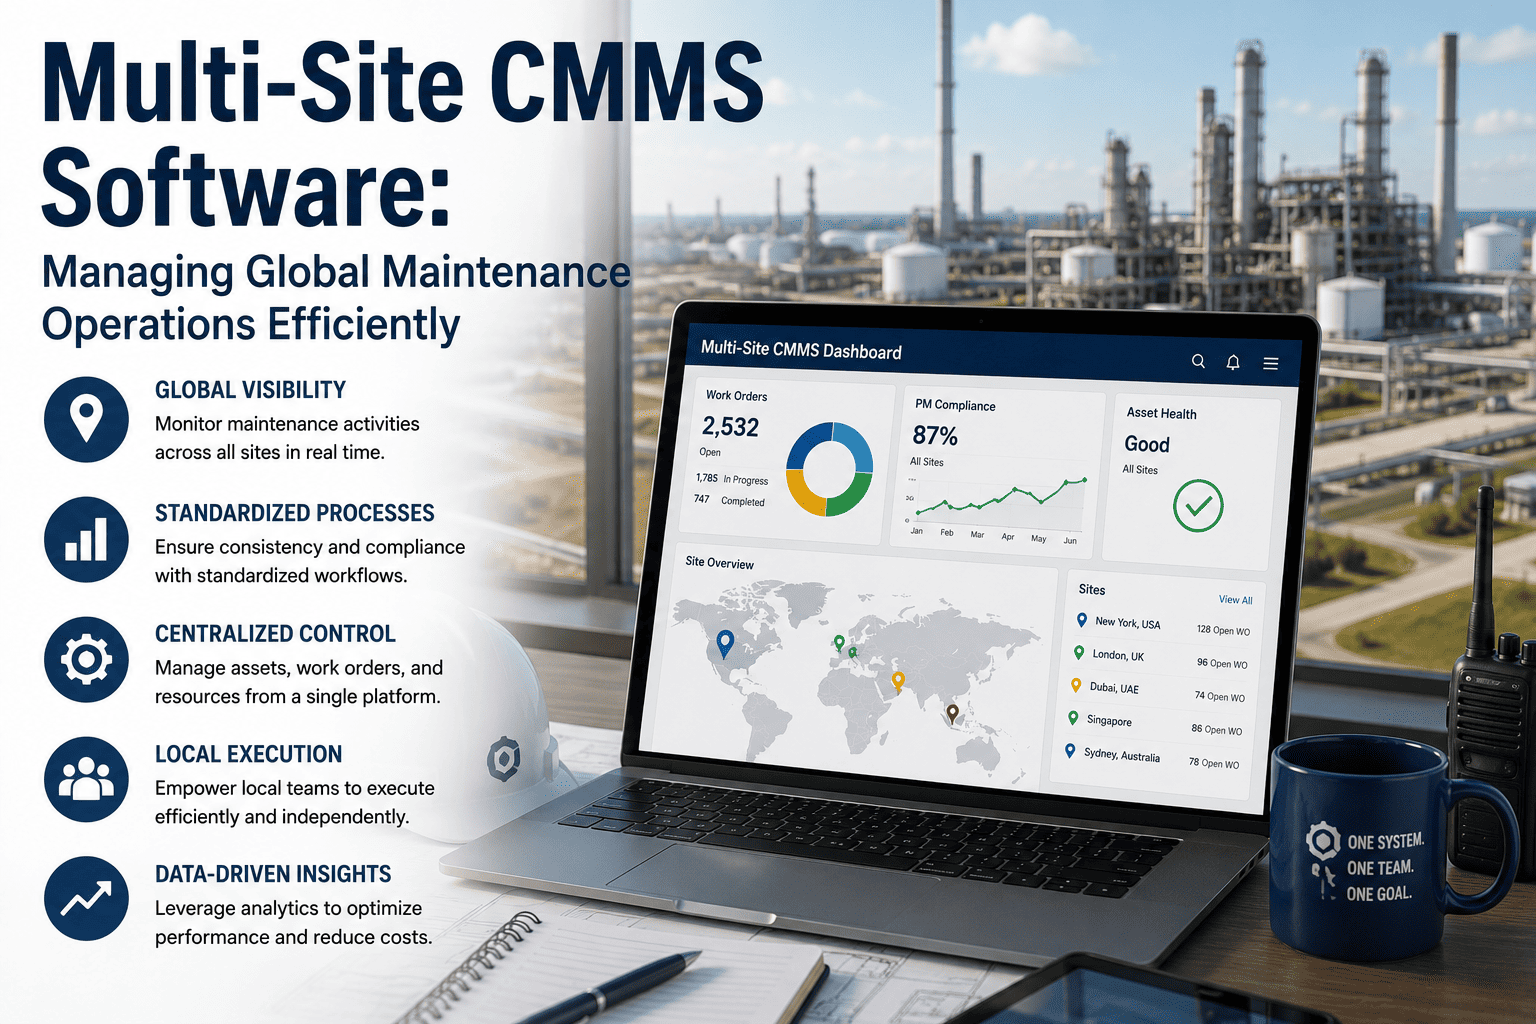
How OxMaint Enables Asset Lifecycle Cost Analysis
Lifecycle cost analysis requires per-asset cost data that accumulates over years of operation. OxMaint builds this record automatically from every work order — so when a repair-vs-replace decision arrives, the cost history is already there, structured and queryable, rather than scattered across spreadsheets, email threads, and filing cabinets. Sign up free and start building the cost record from your next work order.
LH
Asset Lifecycle Cost History
Every work order closed in OxMaint logs total cost — labor and parts — against the specific asset. Cumulative maintenance spend per asset is visible from day one, growing automatically with every repair and PM visit without manual data entry.
TR
Maintenance Cost Trend Reporting
Annual maintenance cost per asset is tracked over multiple years — surfacing the rising cost trend that signals end-of-life before a major failure forces the replacement decision at the worst possible time and price.
RR
Repair vs. Replace Evidence at Point of Decision
When a major repair work order is raised on an aging asset, OxMaint surfaces cumulative maintenance cost, current replacement value, and repair frequency history in the same view — giving the manager and finance team the evidence to make the right call, not just the fastest one.
CP
Capital Planning and FCI Reporting
Export portfolio-level reports showing cumulative maintenance spend, replacement value, and Facility Condition Index scores across your full asset base — the documented evidence that converts a capital replacement request from an opinion into a risk-based business case.
Every Work Order You Close Is a Lifecycle Cost Data Point — Are You Capturing It?
OxMaint turns your maintenance work orders into a per-asset lifecycle cost record — automatically, without additional data entry. When the repair-vs-replace decision arrives, the cost history is already there. Sign up free and start building it from your next work order.
Frequently Asked Questions
What is asset lifecycle cost analysis?
Asset lifecycle cost analysis (LCCA) is the structured process of identifying and quantifying every cost associated with an asset from initial acquisition through to final disposal — including operations and energy, maintenance and repair, downtime and production loss, mid-life upgrades, and decommissioning. The purpose is to replace purchase-price-based procurement decisions with total-cost comparisons, and to give maintenance and capital planning teams the financial framework to make repair-vs-replace decisions and long-range replacement investments on evidence rather than instinct. Industry research consistently shows that acquisition cost represents only 20–25% of total lifecycle cost for industrial and commercial assets — meaning decisions made on purchase price alone are ignoring the majority of what the asset will actually cost. Sign up on OxMaint to start capturing per-asset lifecycle cost data from your existing work orders.
What costs are included in a lifecycle cost analysis?
A complete lifecycle cost model includes six cost categories. Acquisition costs cover purchase price, freight, site preparation, installation, commissioning, and initial spares. Operations and energy costs cover annual energy consumption, consumables, operator labor, insurance, and regulatory compliance costs over the full asset life — for HVAC, motors, and process equipment, energy frequently exceeds acquisition cost over a 10–15 year life. Maintenance and repair costs cover scheduled PM labor and parts, reactive repairs, specialist contractors, and inspection and condition monitoring. Downtime and production loss costs cover the financial value of lost production, idle labor, and consequential costs during unplanned failures. Upgrade and mid-life investment costs cover compliance retrofits, technology upgrades, and major component overhauls. Disposal and decommissioning costs cover safe removal, hazardous material handling, environmental compliance, and site remediation. Residual or scrap value at end of life is deducted from the total.
How do you use lifecycle cost analysis to decide whether to repair or replace an asset?
The repair-vs-replace decision uses lifecycle cost evidence across four key factors. The 50% rule is the most widely applied: when a repair quote exceeds 50% of current replacement value on an asset past two-thirds of its design life, replacement is typically the better economic choice. Beyond that threshold, cumulative maintenance cost trend is the most important signal — an asset whose annual maintenance cost has been rising year over year for three or more years is exhibiting a wear-out pattern where further repair investment compounds rather than resolves the cost problem. Energy efficiency gap between the existing asset and a new equivalent should be quantified — for HVAC, motors, and compressors, a significant efficiency gap means the replacement may recover its cost through energy savings alone over 5–7 years. Parts and OEM support availability affects reliability risk; obsolete parts or discontinued manufacturer support increases the cost and uncertainty of any repair investment. The repair-vs-replace decision requires per-asset maintenance cost history to be made correctly — without it, each repair is evaluated in isolation rather than as part of a cumulative cost pattern. Book a demo to see how OxMaint provides this history at the point of decision.
What is the Maintenance Cost Ratio (MCR) and how does it signal end-of-life?
The Maintenance Cost Ratio (MCR) is calculated as annual maintenance cost divided by current replacement value, expressed as a percentage. It measures how much you are spending to keep an asset running relative to what it would cost to replace it with a new equivalent. An MCR below 5% indicates a healthy asset in productive life — maintenance investment is proportionate to asset value. MCR between 5–10% signals a monitoring zone where the trend should be tracked closely. MCR above 10–15% per year indicates the asset has entered its economic end-of-life zone — the annual cost of maintenance is consuming a meaningful percentage of its replacement value, and continued investment is extending a declining asset rather than building long-term value. Tracking MCR annually per asset is one of the most practical ways to build an objective, evidence-based replacement schedule rather than reacting to each major failure as an isolated event.