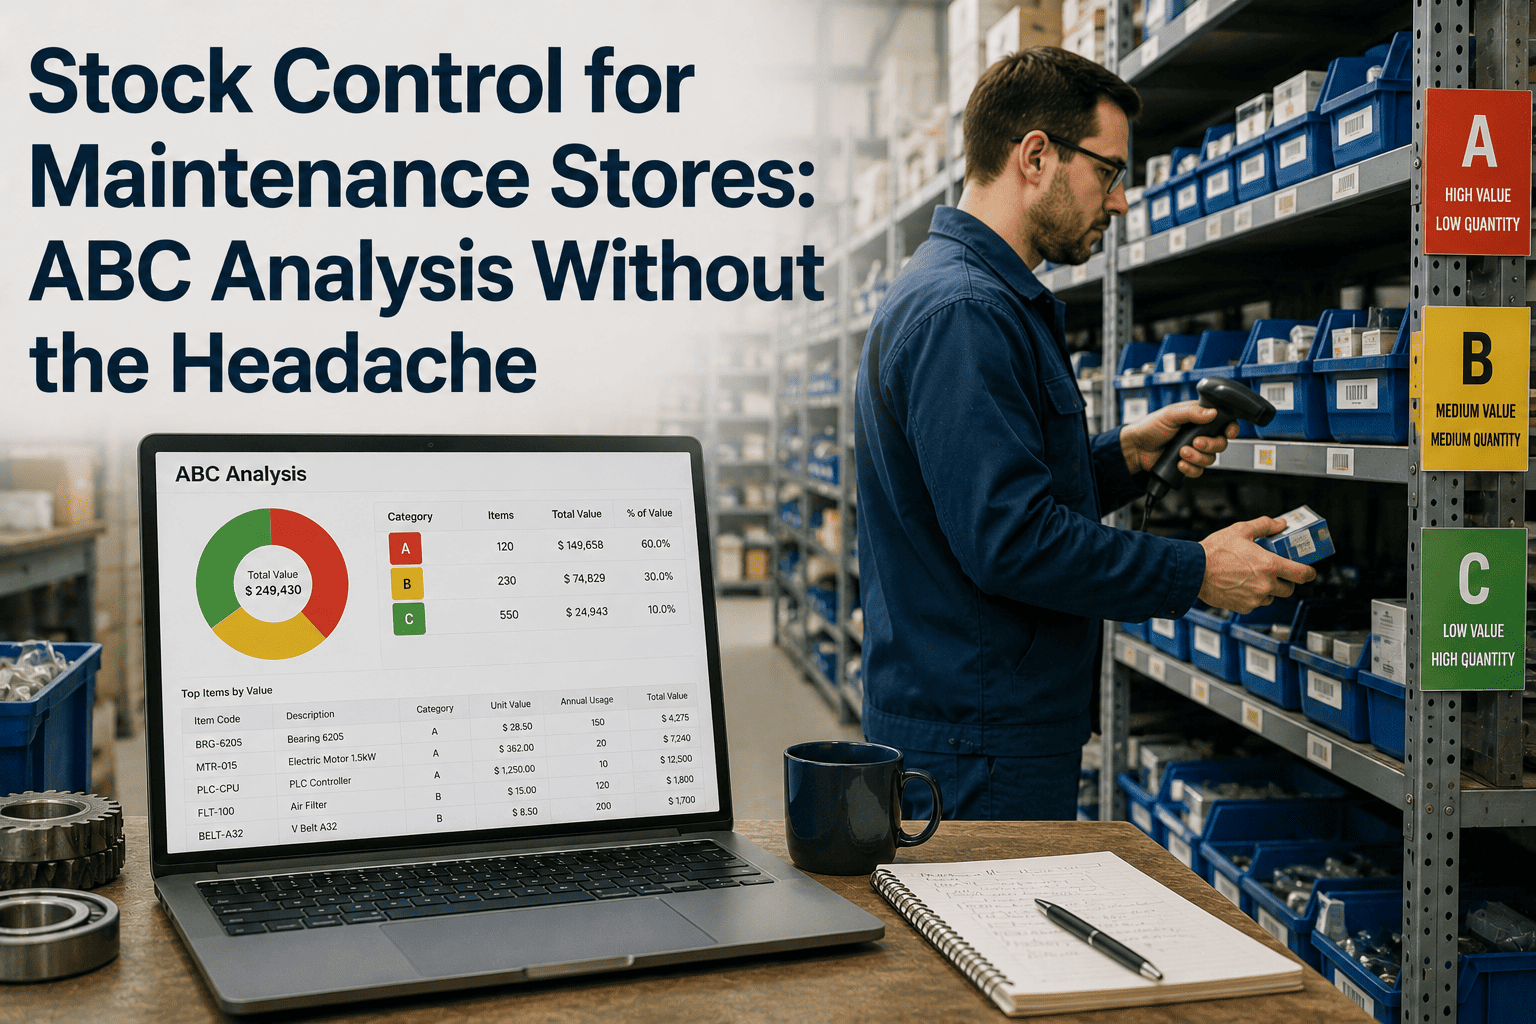
Most maintenance stores have a shelf of critical bearings worth counting every month, right next to a bin of washers that could sit untouched for two years without anyone noticing or caring. Treating both the same way — same count frequency, same reorder rigour, same attention — wastes effort on the washers and risks stockouts on the bearings. ABC analysis exists to fix exactly this, and it doesn't need a consultant or a week-long audit. With twelve months of usage data and an afternoon, most stores can rank every part by where it actually sits in the value pile and set a sensible control policy for each tier. A CMMS like OxMaint runs this ranking automatically from existing issue history, so the classification stays current instead of being a spreadsheet exercise redone once a year.
Let Your Stock Classify Itself From Real Usage Data
Automated ABC classification, reorder points by tier, and cycle count scheduling — so your stores policy updates itself instead of a once-a-year spreadsheet exercise.
The ABC Split: What Goes Where
The classic Pareto split shows up in almost every maintenance store: a small number of parts account for most of the annual spend, while the majority of individual line items barely register on the value scale.
| Category | Typical % of SKUs | Typical % of Annual Value | Control Level |
|---|---|---|---|
| A | ~10-20% | ~70-80% | Tight — frequent counts, precise reorder points |
| B | ~20-30% | ~15-20% | Moderate — periodic review, standard reorder rules |
| C | ~50-70% | ~5-10% | Loose — bulk ordering, infrequent counts |
Adding the XYZ Layer: Demand Predictability
X — Steady Demand
Usage is consistent and predictable month to month, making reorder points straightforward to calculate and trust.
Y — Variable Demand
Usage fluctuates noticeably, often tied to seasonal production changes or planned maintenance campaigns.
Z — Erratic Demand
Usage is sporadic and hard to forecast, often tied to unplanned failures rather than any predictable pattern.
Why Combine With ABC
Value alone doesn't tell you how to hold stock. Combining ABC with XYZ shows which high-value parts also need a safety buffer.
Stock Control Policy by Combined Category
High Value, Predictable
The easiest high-value category to manage. Tight reorder points work well because demand is steady enough to trust the forecast.
Low Value, Erratic
Low individual risk. A simple bulk-buffer or vendor-managed approach avoids spending management time on parts that barely matter financially.
High Value, Erratic
The hardest case: expensive parts with unpredictable demand. These usually need a dedicated critical-spares policy rather than a standard reorder rule.
Running ABC Analysis in an Afternoon
Pull 12 Months' Usage
Export issue history and unit cost for every stock item, giving a full year to smooth out seasonal noise.
Rank by Annual Value
Multiply quantity issued by unit cost for each item, then sort the full list from highest to lowest annual value.
Apply the Cutoffs
Mark the items making up roughly the first 80% of cumulative value as A, the next 15% as B, and the remainder as C.
Assign a Control Policy
Set count frequency and reorder rules per tier, rather than applying one policy to every item in the store.
The Numbers Behind the Split
The value of ABC analysis isn't the ranking itself — it's what changes afterward. Tight control on the small A tier and loose control on the large C tier is where the actual time and cost savings show up. Sign up free to see your stock ranked automatically from real issue history instead of a manual spreadsheet pull.
How OxMaint Supports ABC Stock Control
Automated ABC Classification
Stock is ranked by value and usage automatically from issue history, keeping the classification current without a manual re-run.
Reorder Point by Category
Reorder rules can be set per tier, giving A items tighter control and C items simpler, bulk-friendly rules.
Cycle Count Scheduling by Tier
Count frequency is assigned by category, so stores time is spent where accuracy actually matters most.
Dead Stock Flagging
Items with no issue activity over a defined period are flagged automatically, surfacing candidates for write-off or return.
Stop Counting Washers as Often as You Count Bearings
Automated ABC ranking, tiered reorder points, and smarter cycle counts — built so stores effort goes where the value actually is.
Frequently Asked Questions
How often should ABC classification be re-run?
Annually is a reasonable baseline for most stores, though a significant change in production, equipment fleet, or supplier pricing is a good trigger for an earlier refresh.
Is ABC analysis based on unit cost or total annual value?
Total annual value — unit cost multiplied by quantity issued over the period. A cheap item used in huge volume can rank higher than an expensive item rarely touched, which is exactly what the analysis is meant to reveal.
Should critical spares always be classified as A category?
Not automatically. A critical spare with low annual usage value may rank as C on value alone, but its failure consequence still justifies dedicated stock policy — criticality and ABC value are related but separate considerations.
What's the point of adding XYZ demand variability to ABC value ranking?
ABC alone tells you what's expensive; XYZ tells you how predictable the demand is. Combining them shows which expensive items also need a safety stock buffer, versus which can run on a tight, confident reorder point.
How much time does an ABC analysis typically save in stores management?
The time savings mostly come from the C category — reducing count frequency and simplifying reorder rules for the majority of low-value line items frees up significant hours that can be redirected to the smaller A tier where accuracy actually matters.







