Most maintenance schedules reflect habit, not risk. Assets get serviced on fixed intervals because that is how it has always been done — not because the interval matches their failure pattern, their operational importance, or what a breakdown would actually cost. Asset criticality analysis replaces that habit with a structured, evidence-based framework that tells you which assets genuinely cannot fail, which ones are important but manageable, and which ones can safely run on a lighter maintenance regime. The result is better protection of what matters most, less wasted spend on what matters least, and a maintenance budget that is harder to cut because the logic behind it is documented and defensible. Sign up free on OxMaint to assign criticality scores to your asset register, or book a demo to see how criticality drives maintenance planning in practice.
Give Every Asset in Your Register a Criticality Score — Then Let It Drive Your Maintenance Plan
OxMaint supports five-level asset hierarchies with criticality scoring built in. Assign scores, link them to PM schedules, parts stocking, and work order priority — so your maintenance resource follows risk, not routine.
What Asset Criticality Analysis Is
Asset criticality analysis is a systematic method of evaluating each asset based on the consequences of its failure — across safety, production, environment, cost, and regulatory exposure. The output is a criticality score or tier for every asset, which is then used to drive decisions about maintenance strategy, PM frequency, spare parts stocking, inspection depth, and investment priority.
Without it
Maintenance schedules built on manufacturer intervals, historical habit, or whoever shouts loudest. Every asset treated roughly equally — which means critical assets are under-protected and non-critical assets are over-serviced.
→
With it
Every asset ranked by its true operational importance. Maintenance strategy, PM frequency, and spare parts depth matched to actual failure risk and consequence — not assumption or precedent.
The 80/20 reality of asset criticality: in most operations, 20% of assets generate 80% of maintenance cost, downtime, and failure risk. Asset criticality analysis identifies which 20% — before the failures confirm it for you.
The 5 Factors That Determine Asset Criticality
No single factor determines criticality. An asset that is expensive to replace but has a ready standby unit is not necessarily critical. An inexpensive pump with no redundancy in a critical process line may be your highest-risk asset. Criticality scoring weighs multiple factors to produce a composite risk picture. Sign up on OxMaint to score your assets against these factors directly in your CMMS.
01
Safety and Environmental Impact
Would failure of this asset create a risk of injury, fatality, fire, explosion, or environmental release? Assets whose failure mode includes a safety or environmental consequence always score highest on this dimension — regardless of production impact.
Highest weight — always
02
Production or Operational Impact
Would failure stop production, degrade output quality, reduce capacity, or interrupt a service that the business depends on? Assets on the critical production path score higher than assets in support functions with available alternatives.
High weight
03
Redundancy and Standby Availability
Is there a standby unit or alternative that can carry the load if this asset fails? An asset with a fully functional, automatically switching standby carries lower criticality than an identical asset with no backup — even if both serve the same function.
Moderate weight — reduces score when present
04
Mean Time to Repair (MTTR)
If this asset fails, how long does it take to restore it? Long MTTR assets — those requiring specialist contractors, imported parts, or lengthy commissioning — have higher criticality than identical assets that can be repaired in hours with on-hand spares.
Moderate weight
05
Failure Frequency and Detectability
How often does this type of asset fail, and is failure detectable before it becomes critical? High-frequency failures with no early warning signs — no vibration increase, no temperature rise, no visual indicator — score higher than assets whose degradation is visible and catchable before failure.
Variable weight — depends on monitoring capability
Three Methods for Scoring Asset Criticality
The scoring method you choose should match the data you have available and the precision your operation requires. All three methods produce a criticality tier — the difference is in the granularity of the output and the effort required to get there. Book a demo to see how OxMaint supports structured criticality scoring across your full asset register.
Simplest
Risk Matrix Scoring
Plot each asset on a 5×5 matrix of Consequence (impact of failure) against Likelihood (probability of failure in a given period). The matrix cell determines the criticality tier. Fast to run, easy to explain to stakeholders, and sufficient for most facilities management and manufacturing operations.
Best for: Operations building their first criticality framework with limited historical failure data
Standard
Weighted Factor Scoring
Score each asset against multiple factors — safety, production impact, MTTR, redundancy, failure frequency — with each factor assigned a weight that reflects its importance to your operation. Scores are summed to a weighted total that produces the criticality tier.
Best for: Operations with moderate historical data and multiple stakeholders with different criticality priorities
Most Rigorous
FMEA-Based RPN Scoring
Failure Mode and Effects Analysis (FMEA) evaluates each failure mode of each asset against Severity, Occurrence probability, and Detection difficulty. The three scores are multiplied into a Risk Priority Number (RPN) that ranks failure modes — and by extension the assets that exhibit them — from highest to lowest risk.
Best for: Manufacturing, process industries, or regulated environments with detailed failure history and reliability engineering capability
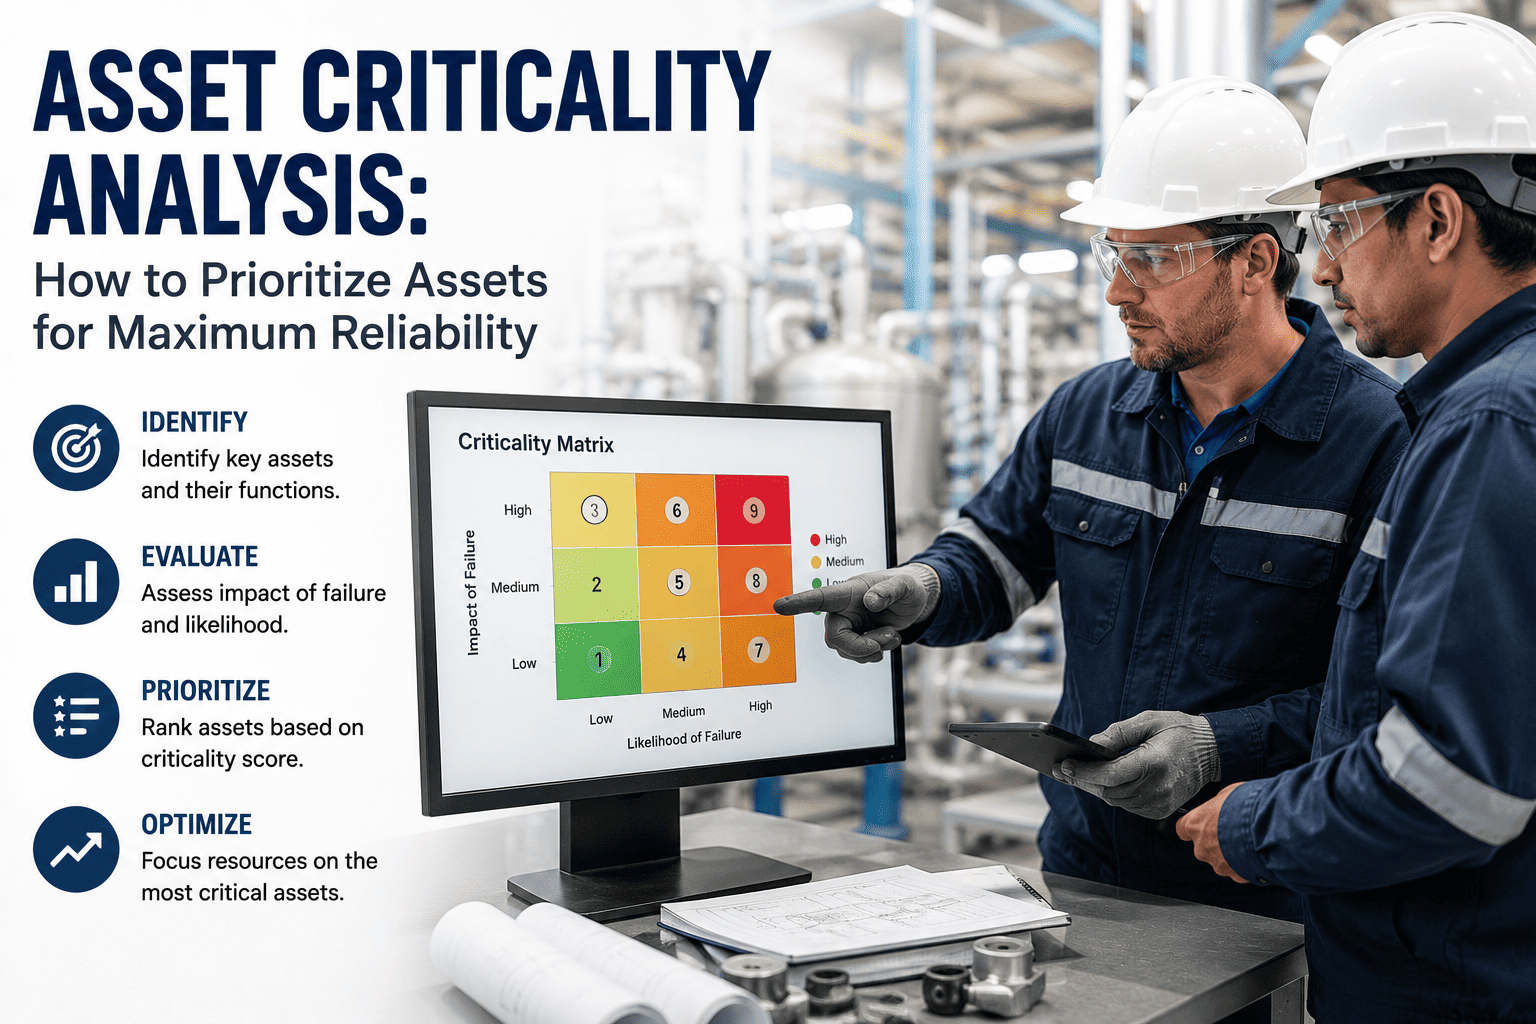
The Criticality Matrix: Visual Output of the Analysis
The criticality matrix is the visual tool that maps every scored asset into a risk tier — making the output of the analysis immediately usable for maintenance planning, parts stocking, and resource decisions. The matrix plots consequence against likelihood and colour-codes assets by the tier the intersection produces.
CONSEQUENCE OF FAILURE
5 — Catastrophic
4 — Critical
3 — Significant
2 — Moderate
1 — Minor
Med
5
High
10
High
15
Crit
20
Crit
25
Low
4
Med
8
High
12
High
16
Crit
20
Low
3
Low
6
Med
9
High
12
High
15
Low
2
Low
4
Low
6
Med
8
High
10
Low
1
Low
2
Low
3
Low
4
Med
5
1
Rare
2
Unlikely
3
Possible
4
Likely
5
Almost Certain
LIKELIHOOD OF FAILURE
Critical (20–25) — Maximum intervention, continuous monitoring
High (10–19) — Intensive PM, condition monitoring, priority response
Medium (5–9) — Standard PM schedule, periodic inspection
Low (1–4) — Basic PM or run-to-failure with spares on hand
How Criticality Tiers Drive Maintenance Strategy
A criticality score is only useful if it changes what you do. The point of the analysis is to produce differentiated maintenance strategies for different asset tiers — not a uniform PM schedule applied to everything. Sign up free on OxMaint to link your criticality tiers directly to PM schedules and work order priority routing.
Critical
Predictive + Preventive maintenance. Continuous or near-continuous condition monitoring. No run-to-failure under any circumstance.
Weekly to monthly — condition-driven intervals
Critical spares held on-site at all times. Supplier agreements for emergency supply.
P1 — Immediate
High
Preventive maintenance with periodic condition assessments. Redundancy reviewed and maintained where available. Vibration and thermal monitoring at defined intervals.
Monthly to quarterly — fixed or condition-driven
Key spares held on-site or in regional warehouse with fast replenishment.
P2 — Within 24h
Medium
Standard preventive maintenance on fixed intervals. Visual inspection at service visits. No continuous monitoring required.
Quarterly to semi-annual — manufacturer interval or historical data-driven
Standard spares via preferred supplier. Lead time acceptable given lower production criticality.
P3 — This week
Low
Run-to-failure or minimal preventive maintenance. Safety checks only where required. Resource investment not warranted by failure consequence.
Annual or reactive — driven by inspection findings only
No on-site spares. Order on failure. Acceptable downtime while parts sourced.
P4 — Scheduled
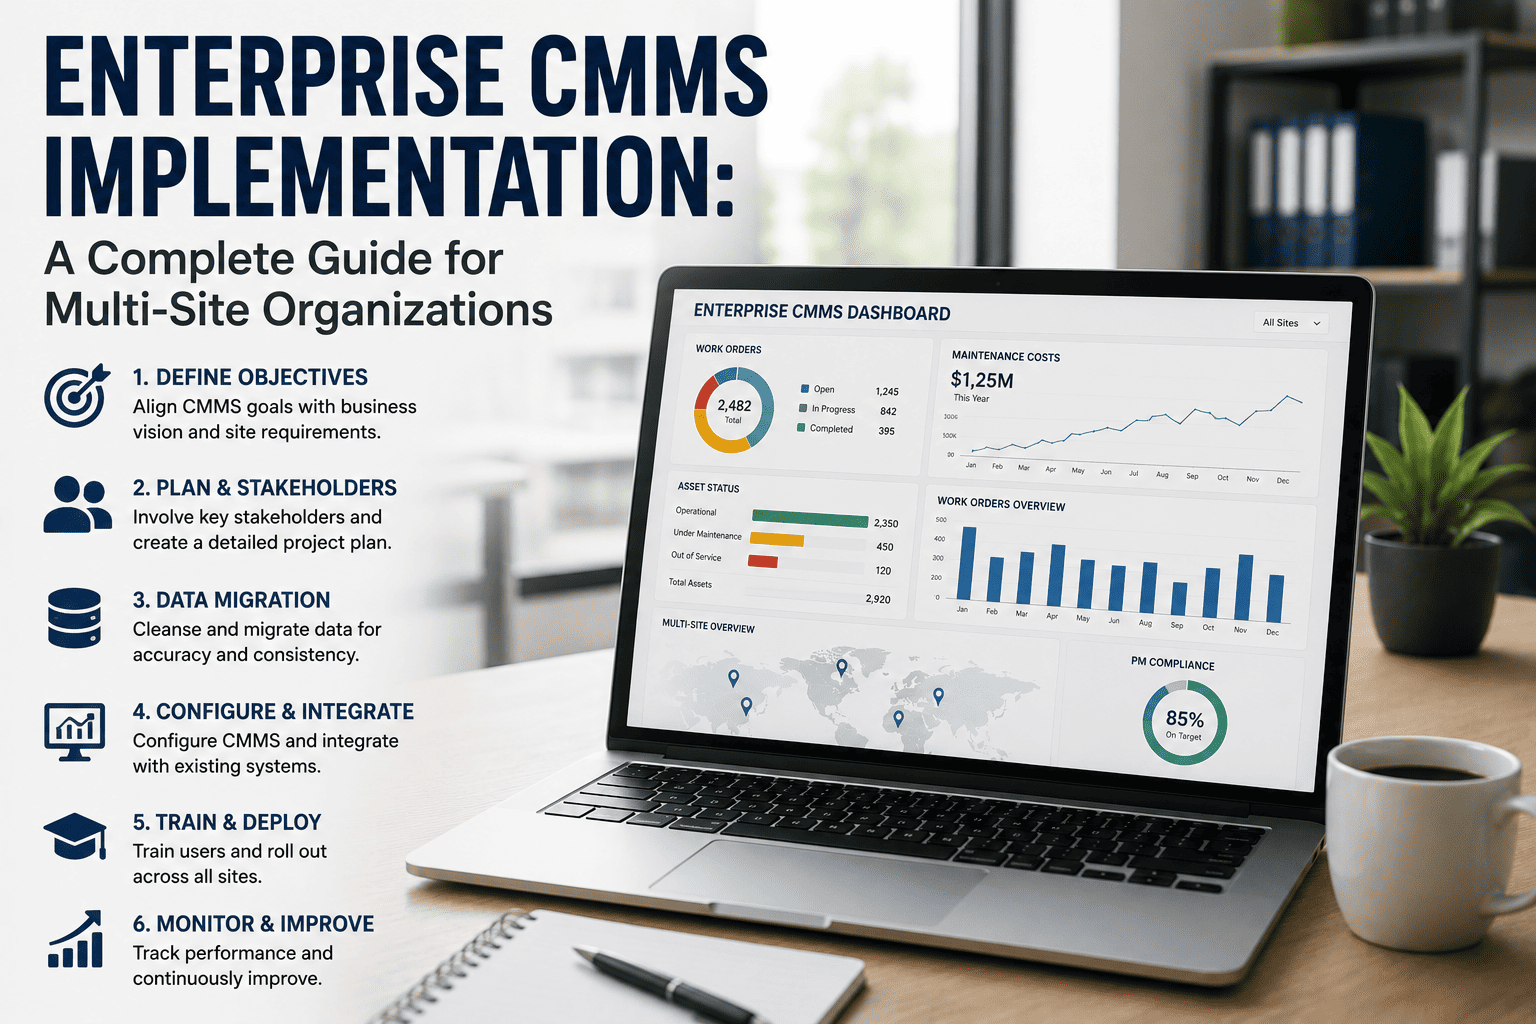
How to Run an Asset Criticality Assessment: Step by Step
The assessment does not need to be done for every asset at once. Starting with the assets you suspect are highest risk — or the categories that generate the most unplanned downtime — and expanding from there is the most practical path to a complete, useful output. Book a demo to see how OxMaint structures the assessment workflow from asset register through to scored output.
1
Build a complete, clean asset register
You cannot score what is not in the system. Before scoring, verify that your asset register is complete, de-duplicated, and structured in a hierarchy that reflects how assets relate to systems and production lines. Missing assets and duplicate records produce criticality gaps that leave real risks unscored.
2
Assemble a cross-functional scoring team
Asset criticality is not a maintenance department decision. Operations knows which production lines are most critical. Safety knows which assets carry regulatory or hazard exposure. Finance knows replacement cost and insurance implications. A team drawn from all three produces a score that reflects business impact, not just maintenance preference — and is more defensible to leadership.
3
Define scoring criteria before starting
Agree what a score of 5 on consequence means in your operation — production stopped for more than 24 hours? Injury risk? Regulatory notification required? Without pre-agreed definitions, different people score the same asset differently and the results are inconsistent across your portfolio. Document criteria before the first asset is scored.
4
Score each asset against defined factors
Work through your asset register systematically, scoring each against your chosen factors — consequence, likelihood, redundancy, MTTR, and any operation-specific factors. Use historical maintenance data (failure frequency, repair time, parts cost) where available to anchor scores in evidence rather than judgment alone.
5
Assign tiers and validate against operational reality
Apply your scoring thresholds to produce tier assignments. Then validate against what you already know — are the assets that your experienced technicians consider most critical actually landing in the Critical or High tier? Systematic scoring removes bias, but experienced operational judgment is a legitimate sense-check on outputs that seem counter-intuitive.
6
Update PM schedules, spares, and priorities to match tiers
The criticality tier drives action: revise PM frequencies for critical and high-tier assets, review spare parts holdings against MTTR for critical assets, update work order priority routing so critical asset jobs are automatically elevated, and flag any critical assets currently receiving only reactive maintenance as immediate improvement targets.
7
Review and update scores annually
Asset criticality changes. A new production line changes which assets are on the critical path. A standby unit installed on a previously vulnerable pump reduces its criticality. Process changes alter what failure costs. An annual review — or immediate review after any significant operational change — keeps the criticality picture current and the maintenance strategy aligned to actual risk.
What Changes When You Implement Asset Criticality
10–15%
Reduction in overall maintenance spend
By removing over-maintenance from low-criticality assets and redirecting resource to where failure risk is highest
20%
Of assets typically drive 80% of downtime risk
Identifying that 20% and protecting them is the single highest-return maintenance investment most operations can make
30–40%
Reduction in unplanned critical asset downtime
Achieved by operations that shift from uniform PM intervals to criticality-driven strategies with condition monitoring on top-tier assets
Defensible
Capital and maintenance budget justification
Criticality scores provide the documented evidence base that converts budget requests from maintenance opinion to risk-based business cases
Common Mistakes in Asset Criticality Analysis
Asset criticality analysis is straightforward in concept but easy to undermine in practice. These are the mistakes that produce a criticality score that looks complete but does not change how maintenance decisions are made. Sign up free on OxMaint to embed criticality scoring into your asset register where it stays visible and actionable.
!
Scoring everything as critical
When every asset scores high, the criticality framework collapses — because nothing is differentiated and the analysis produces no change in behavior. Best practice is to target 10–15% of assets in the Critical tier and accept that most assets are Medium or Low. If your Critical list exceeds 25% of assets, re-examine your scoring criteria.
!
Treating replacement cost as a proxy for criticality
An expensive asset is not necessarily a critical one. A high-cost piece of equipment with a standby unit, fast repair capability, and no safety exposure may be legitimately Low criticality. A cheap pump with no backup in a critical process line is Critical. Cost is relevant to parts stocking decisions — it is not a substitute for consequence-based scoring.
!
Not linking scores to PM schedules
An asset criticality score stored in a spreadsheet that does not update PM frequencies, work order priorities, or parts stocking decisions is a documentation exercise, not a maintenance improvement. The score must be operationalized — ideally embedded in the CMMS so every downstream decision reflects it automatically.
!
Running the analysis once and never updating it
Criticality is not a fixed property of an asset. Operational changes, new installations, process redesign, and the addition of standby units all change the risk picture. A criticality assessment that is not reviewed annually becomes progressively less accurate and eventually drives maintenance decisions that no longer reflect actual risk.
How OxMaint Supports Asset Criticality Analysis
Criticality analysis produces value only when the scores are embedded in the system that drives day-to-day maintenance decisions. OxMaint builds criticality scoring directly into the asset register — so it is not a separate spreadsheet that maintenance managers consult occasionally, but the live logic that drives PM scheduling, work order prioritization, and parts stocking decisions on every job. Sign up free to start scoring your asset register today.
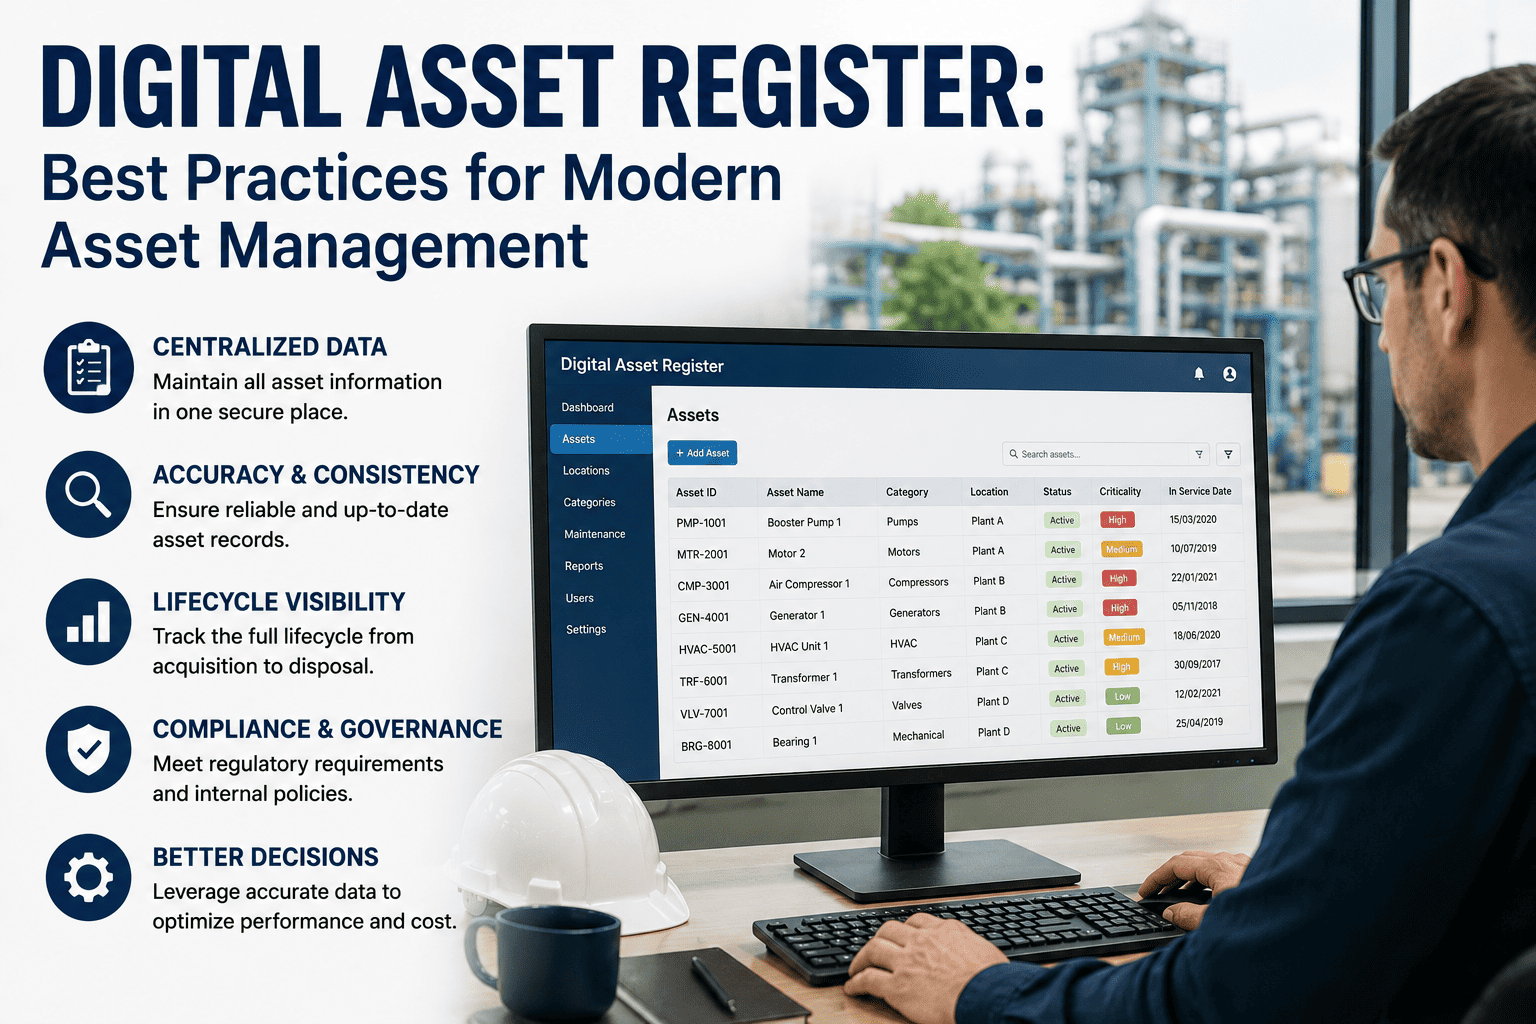
CR
Criticality Scoring in the Asset Register
Every asset in OxMaint carries a criticality score from 1–5 (or Low through Critical). The score is visible on the asset record and drives PM priority, work order routing, and parts stocking recommendations — not stored separately where it gets ignored.
PM
Criticality-Driven PM Schedules
PM frequency and inspection depth are linked to criticality tier. Critical assets generate more frequent, more detailed PM tasks automatically. Low-tier assets generate lighter schedules — without manual maintenance planning for every asset individually.
WO
Work Order Priority by Asset Tier
Reactive work orders on Critical and High-tier assets are automatically elevated in the queue. Technicians and managers see at a glance which jobs involve critical assets — so response time and resource decisions reflect risk, not submission order.
RP
Failure History and Cost by Criticality Tier
Maintenance cost, failure frequency, MTTR, and repair history are reportable by criticality tier — giving you the evidence to validate scores, identify assets whose tier should be revised, and present risk-based maintenance investment cases to leadership.
Stop Treating All Assets Equally — Start Maintaining by Risk
OxMaint embeds criticality scoring into your asset register and links it to PM schedules, work order priority, and spare parts decisions — so your maintenance resource automatically follows risk, not routine. Sign up free and score your first asset tier today.
Frequently Asked Questions
What is asset criticality analysis?
Asset criticality analysis is a systematic method of evaluating each asset based on the consequences and likelihood of its failure — across safety, production, environment, repair time, and redundancy. The output is a criticality score or tier for every asset that is then used to determine maintenance strategy, PM frequency, spare parts stocking depth, condition monitoring investment, and work order priority. It replaces uniform maintenance intervals applied to all assets with differentiated strategies matched to actual failure risk and consequence — directing the most intensive maintenance resource toward the assets where failure would cause the greatest harm. Sign up on OxMaint to score your assets and link criticality tiers to your PM schedules and work order workflow.
What factors are used to determine asset criticality?
The five core factors in asset criticality scoring are: safety and environmental impact (highest weight — any failure mode that creates injury or regulatory exposure automatically elevates criticality), production or operational impact (whether failure stops output or degrades service), redundancy and standby availability (a standby unit significantly reduces criticality of an otherwise identical asset), mean time to repair (assets with long restoration times carry higher criticality because failures last longer), and failure frequency and detectability (high-frequency failures with no early warning signs score higher than assets whose degradation is gradual and monitorable). The factors are weighted and combined into a composite score — most operations use a weighted factor model or a simple consequence-times-likelihood risk matrix.
How do you build an asset criticality matrix?
An asset criticality matrix plots every asset on a grid with consequence of failure on the vertical axis (typically scored 1–5, from minor to catastrophic) and likelihood of failure on the horizontal axis (1–5, from rare to almost certain). Multiplying the two scores produces a risk number from 1 to 25. Assets scoring 20–25 are Critical, 10–19 are High, 5–9 are Medium, and 1–4 are Low. The matrix makes the tier assignment visual and easy to explain to stakeholders — a pump that scores 4 on consequence and 4 on likelihood (score 16, High tier) is clearly riskier than a motor that scores 5 on consequence but only 1 on likelihood (score 5, Medium tier). The matrix also guides where to focus condition monitoring and redundancy investment. Book a demo to see how OxMaint embeds this scoring in your asset register.
How does asset criticality analysis improve maintenance performance?
Asset criticality analysis improves maintenance performance by aligning maintenance strategy, resource deployment, and investment to actual risk — rather than applying uniform effort across all assets regardless of their failure consequence. Operations that implement criticality-driven maintenance typically see 10–15% reductions in overall maintenance spend by removing over-maintenance from low-criticality assets, 30–40% reductions in unplanned downtime on critical assets by ensuring they receive intensive preventive maintenance and condition monitoring, and significantly improved capital budget justification because replacement and upgrade requests are supported by documented risk evidence rather than maintenance opinion. It also enables better parts stocking decisions — holding critical spares on-site only for assets where a failure without spare parts on hand would be unacceptable, rather than attempting to stock for every asset in the register.