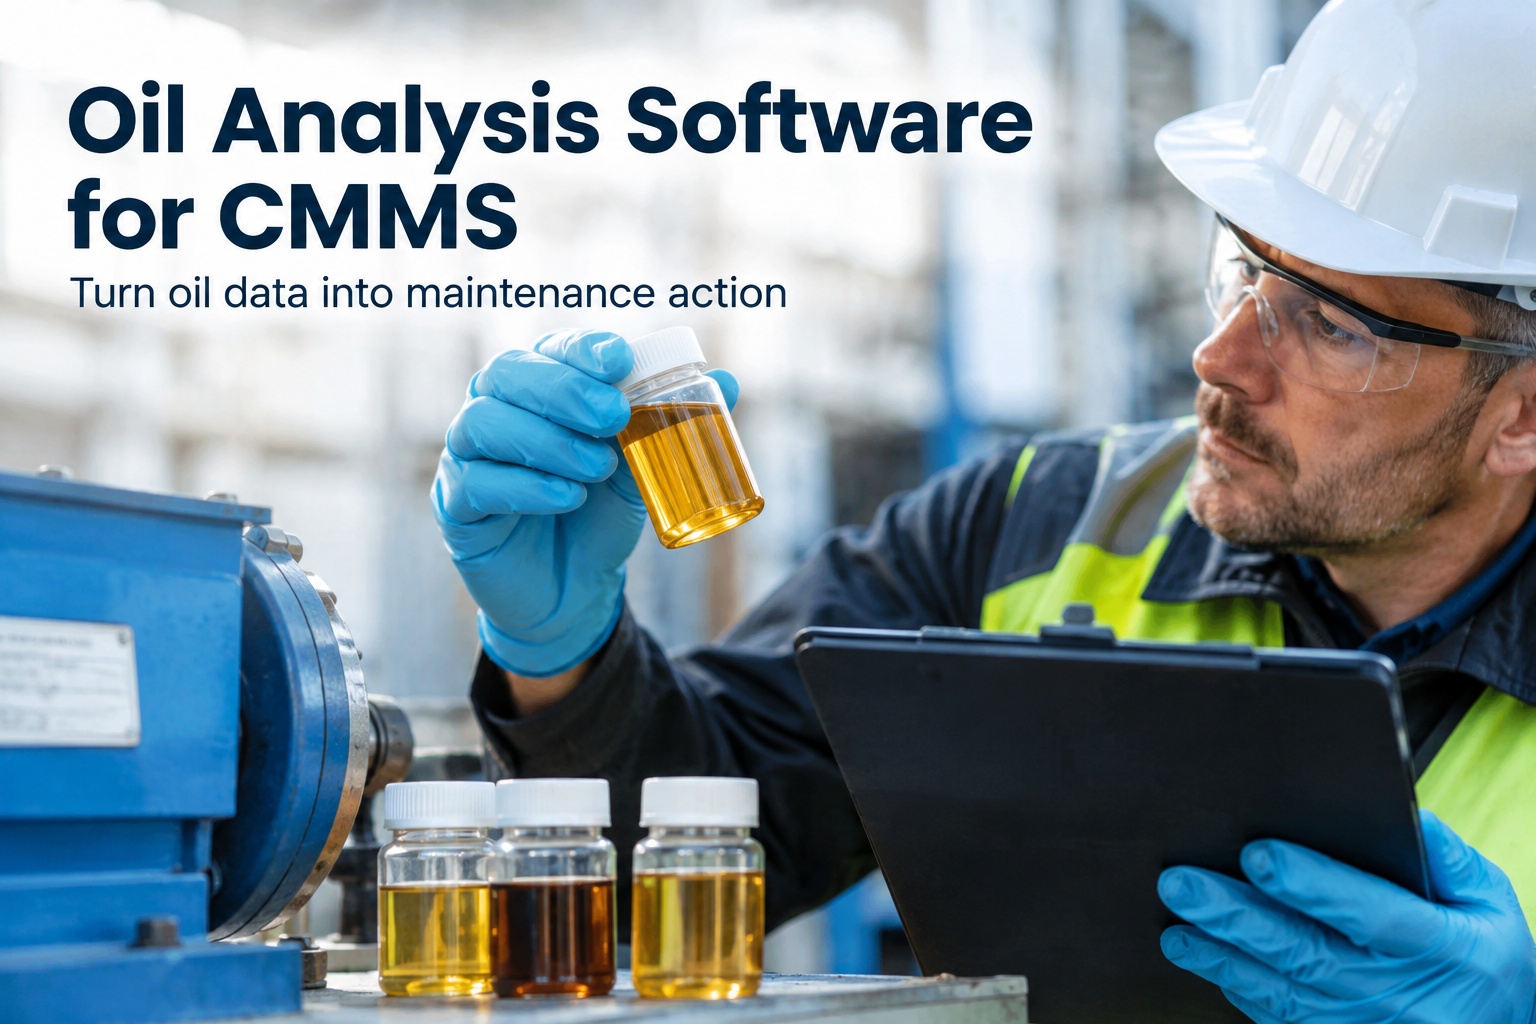
Oil analysis only earns its cost when a laboratory result changes what somebody does next. Oxmaint captures lab reports against the individual asset, trends wear metals, viscosity and contamination sample by sampleand raises a prioritised work order the moment a limit or a pattern says something is developing. Start a free trial or book an oil and fluids demo to see your own sample history trended.
Oil Analysis Software for CMMS
The report lands in your inbox. A couple of values are drifting the wrong way. The machine is still running, production wants it left alone, and nobody wants to pull a pump on a hunch. That moment is where most oil analysis programmes quietly fail.
Read the metals, find the component
Every element in a spectrometric result points at a specific part of the machine. Tied back to the bill of materials, a PDF full of numbers becomes a diagnosis.
Bring a recent report and we will decode it against your machine bill of materials. Book a demo to see it done live.
Three tests, three different warning windows
Most programmes run spectroscopy alone and wonder why bearings still fail. The tests do not see the same things at the same time.
Oil analysis reportedly identifies around 90% of bearing failures through microscopic wear particles before vibration monitoring raises an alarm. The three tests together are what deliver that. Book a demo to see how the three panels sit on one asset timeline.
When a result should become a job
Configure the limits once and the platform decides, rather than a busy engineer skimming a PDF on a Friday afternoon.
| Indicator | What it tells you | Typical action trigger |
|---|---|---|
| Water content | Corrosion risk, additive stripping | Above 0.05% |
| Particle count | Ingress or filtration failure | ISO code rising two levels |
| Glycol | Coolant ingress, immediate concern | Detected at any level |
| Viscosity | Oxidation, thermal ageing or dilution | Shift beyond 10% of grade |
| Wear metals | Component surfaces shedding material | Above baseline trend or lab limit |
| Silicon | Dust ingress through a pathway | Sustained rise across samples |
Limits vary by lubricant, manufacturer specification and asset. Industrial iron alert bands often sit around 20 to 50 ppm, whereas aviation applications work to roughly 4 ppm. Set yours per asset, not per fleet. Book a demo and we will configure a limit set against your equipment.
The signal most programmes miss
A single result rarely proves anything. The rate of change usually does, and it moves well before any threshold is crossed.
A wear metal rate doubling across three consecutive samples is an action signal even while the absolute value sits below the alert threshold. Oxmaint escalates on the slope, not only on the breach, so the investigation starts while the repair is still small. Book a demo to see slope alerting on your own sample history.
How often to sample
Criticality sets the interval. Sampling everything monthly wastes budget; sampling the wrong assets annually wastes machines.
One prevented gearbox failure, commonly valued between fifty thousand and three hundred thousand pounds in repair and lost production, typically pays for a monitoring programme covering ten to twenty assets. Book a demo to build a sampling plan around your criticality ranking.
Getting the sample right
Sampling discipline is what makes the data worth trending. Book a demo and we will review your current routine.
Questions we get asked
Something not answered here? Book a demo and ask directly.
Bring your last three lab reports
In thirty minutes we will trend them against the asset, show you where the slope is already moving and what the alert configuration would look like on your equipment. No obligation, and the free trial runs without a credit card.







