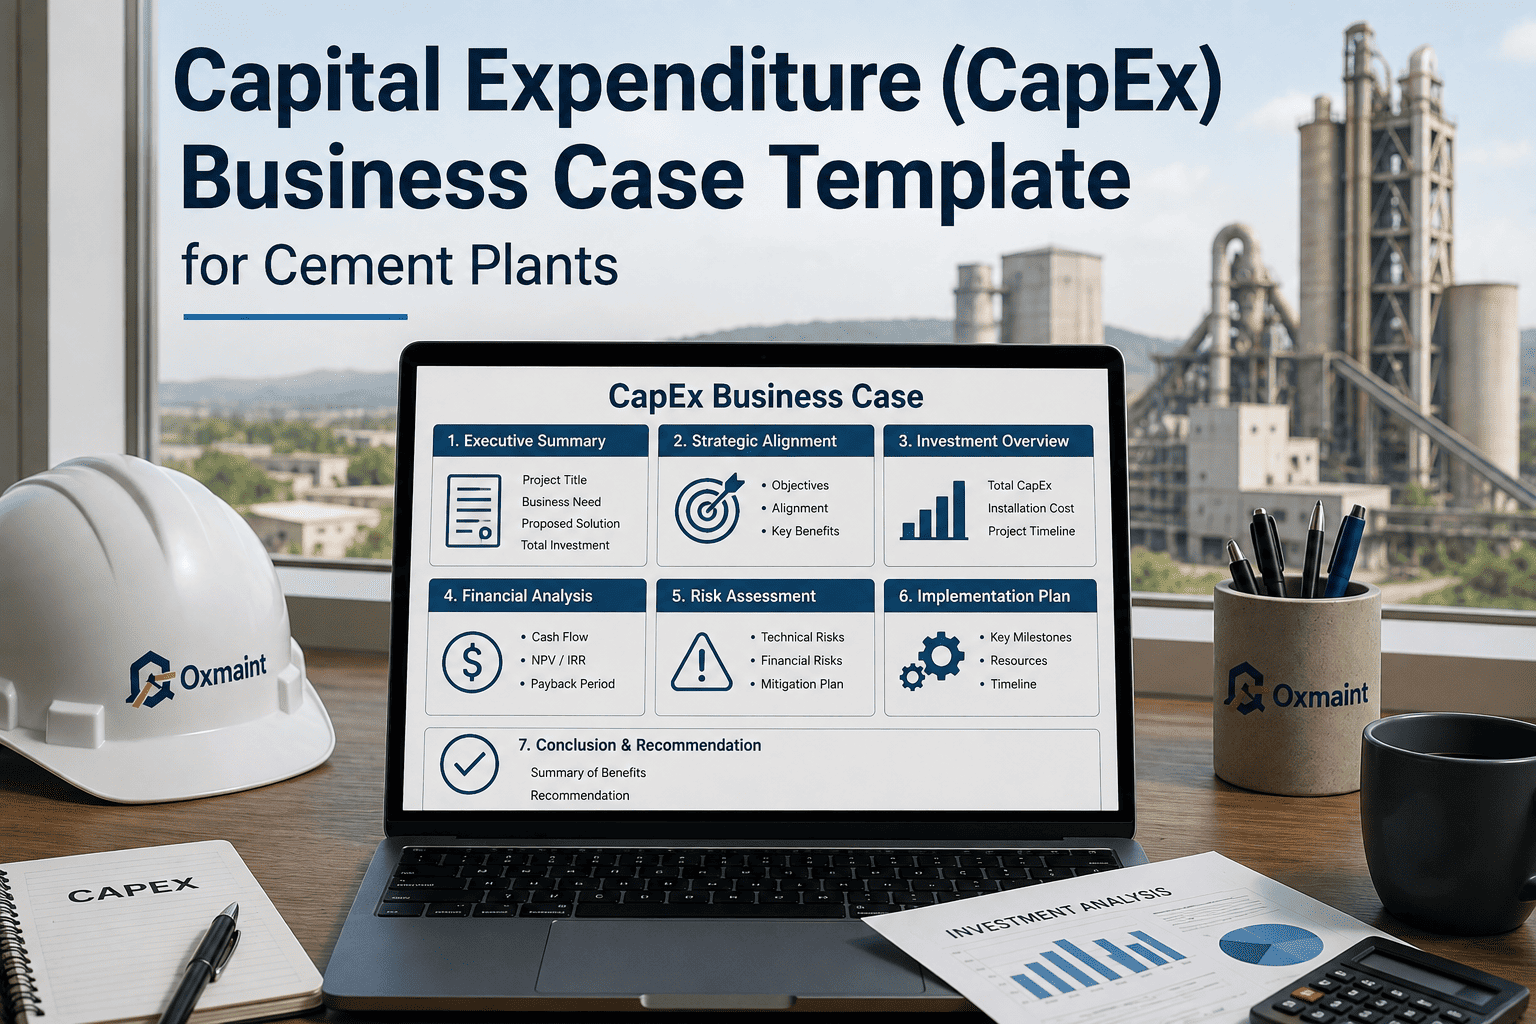
Most CapEx requests in a cement plant don't get rejected because the equipment doesn't need replacing — they get rejected because the business case can't survive a finance review. A gearbox that's failed three times this year is an obvious maintenance problem, but "obvious" doesn't clear a capital committee. What clears it is a business case with real ROI, NPV, IRR, and lifecycle cost numbers behind it. This guide breaks down how to build one, and gives you a ready-to-use CapEx business case template built for cement plant asset replacement decisions. Start your free trial on Oxmaint or book a live demo to see how cement plants are turning maintenance data into approved capital.
46%
of maintenance-driven CapEx requests are rejected or delayed due to weak financial justification
4-6
months average delay between an asset failure risk being flagged and capital being approved
2.8x
higher approval rate for requests that include NPV and payback period alongside repair cost
30%
of lifecycle cost typically hidden in reactive repairs that never make it into a replace-vs-repair case
The 4 Gaps That Get CapEx Requests Rejected
Before you can build a business case that survives a finance review, you need to know why most maintenance-driven requests get sent back. These four gaps show up across cement plants of every size — and every one of them is fixable with the right data behind the request.
01
No Lifecycle Cost Comparison
The request compares purchase price to nothing — repair cost, downtime cost, and energy loss from the aging asset are never quantified against it.
02
Missing ROI, NPV, or IRR
The case states the asset needs replacing but never shows the return, so finance has no number to weigh against other capital priorities.
03
Risk Framed as Opinion, Not Data
"It could fail any time" isn't a number. Without failure history and condition trends, urgency reads as guesswork instead of evidence.
04
No Alternatives Considered
A single option — replace now — is presented with no comparison to repair, refurbish, or delay, leaving the committee nothing to weigh it against.
Build your next CapEx case on real asset data
Oxmaint turns maintenance history, downtime cost, and asset condition into the numbers your business case needs.
How a CapEx Business Case Comes Together: The Full Workflow
A business case that gets approved isn't written the night before the capital meeting. It's built in a sequence, with each step feeding the number finance actually reads first.
1
Asset Condition Assessment
Pull failure history, current condition score, and maintenance cost trend for the asset in question — the kiln drive, mill gearbox, or ESP in play.
Failure history
Condition score
Maintenance cost trend
▼
2
Lifecycle Cost Analysis
Compare total cost of keeping the asset — repairs, downtime, energy loss — against the cost of replacement over its expected service life.
Repair cost
Downtime cost
Energy loss
▼
3
ROI, NPV, and IRR Calculation
Translate the lifecycle comparison into the return, payback period, and discounted value finance uses to rank this request against every other one.
ROI calculation
NPV modeling
IRR and payback
▼
4
Risk and Alternatives Comparison
Lay out repair, refurbish, delay, and replace side by side, with the risk and cost of each option stated plainly, not buried in narrative.
Option comparison
Risk-adjusted view
Failure probability
▼
✓
Approval-Ready Business Case
A complete case is assembled with the numbers, the comparison, and the recommendation — ready to present without a follow-up data request.
Finance-ready format
Clear recommendation
Supporting data attached
What Finance Actually Looks For in a CapEx Case
Maintenance teams and finance teams read a business case differently. These four numbers are what determine whether your request gets approved, deferred, or sent back for more information.
R
ROI
Return on investment shows the gain from the replacement relative to its cost — the first number most reviewers check.
N
NPV
Net present value discounts future savings back to today's dollars, showing whether the investment truly adds value.
I
IRR
Internal rate of return lets finance compare this request against every other capital project competing for the same budget.
P
Payback Period
How long it takes for savings to cover the investment — the number that turns a maintenance need into a funded project.
Turn asset condition data into an approved CapEx case
From failure history to ROI and NPV — Oxmaint gives you the numbers finance expects to see.
Book a Demo
CapEx Business Case Readiness: The Checklist
Before a business case goes to the capital committee, these six items should be complete. If any box is open, the case is going to come back with questions instead of an approval.
Asset Condition and Failure History Documented
Current condition score, breakdown frequency, and maintenance cost trend are pulled from actual records, not estimated from memory.
Lifecycle Cost Comparison Complete
Total cost of continued repair versus replacement is calculated across the asset's expected remaining service life.
ROI, NPV, and IRR Calculated
All three financial measures are included, not just payback period, so the request can be ranked against other capital projects.
Alternatives Compared Side by Side
Repair, refurbish, delay, and replace are each shown with their cost and risk, not just the preferred option alone.
Risk of Delay Quantified
The cost and probability of failure if the request is deferred is stated as a number, not a warning in narrative form.
Recommendation Clearly Stated
The case ends with a single, clear recommendation and timeline, not a list of options left for the committee to decide alone.
Before vs. After: Building the Business Case
Without a Structured Business Case
Request based on "it keeps breaking down" with no cost trend attached
No ROI, NPV, or IRR — finance has nothing to rank it against
Only one option presented — replace, with no comparison
Risk of delay described in words, not quantified in dollars
Request sent back for more data, adding months to approval
With Oxmaint-Backed Business Case
Request built on documented failure history and cost trend
ROI, NPV, IRR, and payback period included from the start
Repair, refurbish, delay, and replace all compared side by side
Cost and probability of failure stated as a clear number
Case approved on first review without a follow-up data request
Where CapEx Business Cases Go Wrong
| Business Case Problem |
Root Cause |
Fix |
| Request rejected outright |
No ROI, NPV, or IRR included — finance can't compare it to other projects |
Financial model calculated from asset cost and maintenance data before submission |
| Sent back for more information |
Lifecycle cost of repair versus replacement was never quantified |
Full lifecycle cost comparison built from failure and repair cost history |
| Urgency not taken seriously |
Risk of delay described qualitatively instead of as a dollar figure |
Risk of failure quantified using condition trend and downtime cost data |
| Approved but underfunded |
Only replacement cost estimated — installation, commissioning, and ramp-up left out |
Full project cost included, not just equipment purchase price |
| Repeated requests for the same asset |
Previous repair spend never tracked against the asset to show the pattern |
Maintenance cost history tracked per asset to show the trend over time |
Key Metrics That Strengthen a CapEx Business Case
R
Return on Investment
The core measure of gain versus cost, calculated against the full replacement cost, not just the equipment price.
N
Net Present Value
Future savings discounted to today's value, showing whether the investment genuinely adds value over time.
P
Payback Period
How many months or years until the investment pays for itself through avoided repair and downtime cost.
M
Maintenance Cost Trend
Rising repair spend on a single asset over time is often the strongest evidence a business case can present.
2.8x
higher first-pass approval rate for CapEx cases that include NPV and IRR alongside cost
4-6
months of approval delay avoided when lifecycle cost and risk are quantified upfront
30%
of hidden lifecycle cost captured and included once reactive repair spend is tracked per asset
How Oxmaint Powers CapEx Business Case Planning
Cement plants building capital requests from memory and scattered spreadsheets are fighting an uphill battle against every other project competing for the same budget. Oxmaint connects asset condition history, maintenance cost trends, and downtime data into the numbers a CapEx business case actually needs. Start for free and build your next business case on real asset data.
Asset Condition and Failure Tracking
Full failure history, condition scores, and repair frequency tracked per asset, ready to pull into any business case.
Maintenance Cost Trend Analysis
See exactly how repair spend on an asset has climbed over time, the single strongest evidence for a replacement case.
Downtime Cost Calculation
Downtime linked to the asset is quantified in lost production value, not just hours, for a real lifecycle comparison.
Lifecycle Cost Comparison
Repair, refurbish, and replace scenarios are compared side by side using actual plant data, not rough estimates.
ROI, NPV, and IRR Ready Data
Export the exact figures your finance team needs to model return, discounted value, and internal rate of return.
Business Case Ready Reports
Generate a clean summary of condition, cost, and risk data formatted for submission to your capital committee.
Stop Guessing. Start Getting CapEx Approved.
Oxmaint gives cement plant maintenance teams the asset condition history, cost trends, and downtime data behind every strong CapEx business case — so your next request gets approved on the first review, not the third.
Frequently Asked Questions
What should a CapEx business case for a cement plant asset include?
A complete case includes asset condition and failure history, a lifecycle cost comparison between repair and replacement, ROI, NPV, and IRR calculations, a comparison of alternatives, the quantified risk of delay, and a clear recommendation with timeline.
How is ROI different from NPV and IRR in a capital request?
ROI shows the overall return relative to cost, NPV discounts future savings to today's value to show if the investment truly adds value, and IRR gives finance a rate they can use to rank this request against every other capital project competing for the same budget.
Why do maintenance-driven CapEx requests get rejected so often?
Most rejected requests describe the maintenance problem clearly but never translate it into the financial terms a capital committee evaluates against. Without ROI, NPV, lifecycle cost, and a comparison of alternatives, the request has no number finance can rank against competing projects.
Can Oxmaint help build the financial case, not just track maintenance?
Yes. Oxmaint tracks the asset condition, failure history, repair cost trend, and downtime cost that feed directly into a lifecycle cost comparison and ROI, NPV, and IRR calculations, giving you the data foundation a strong business case is built on.