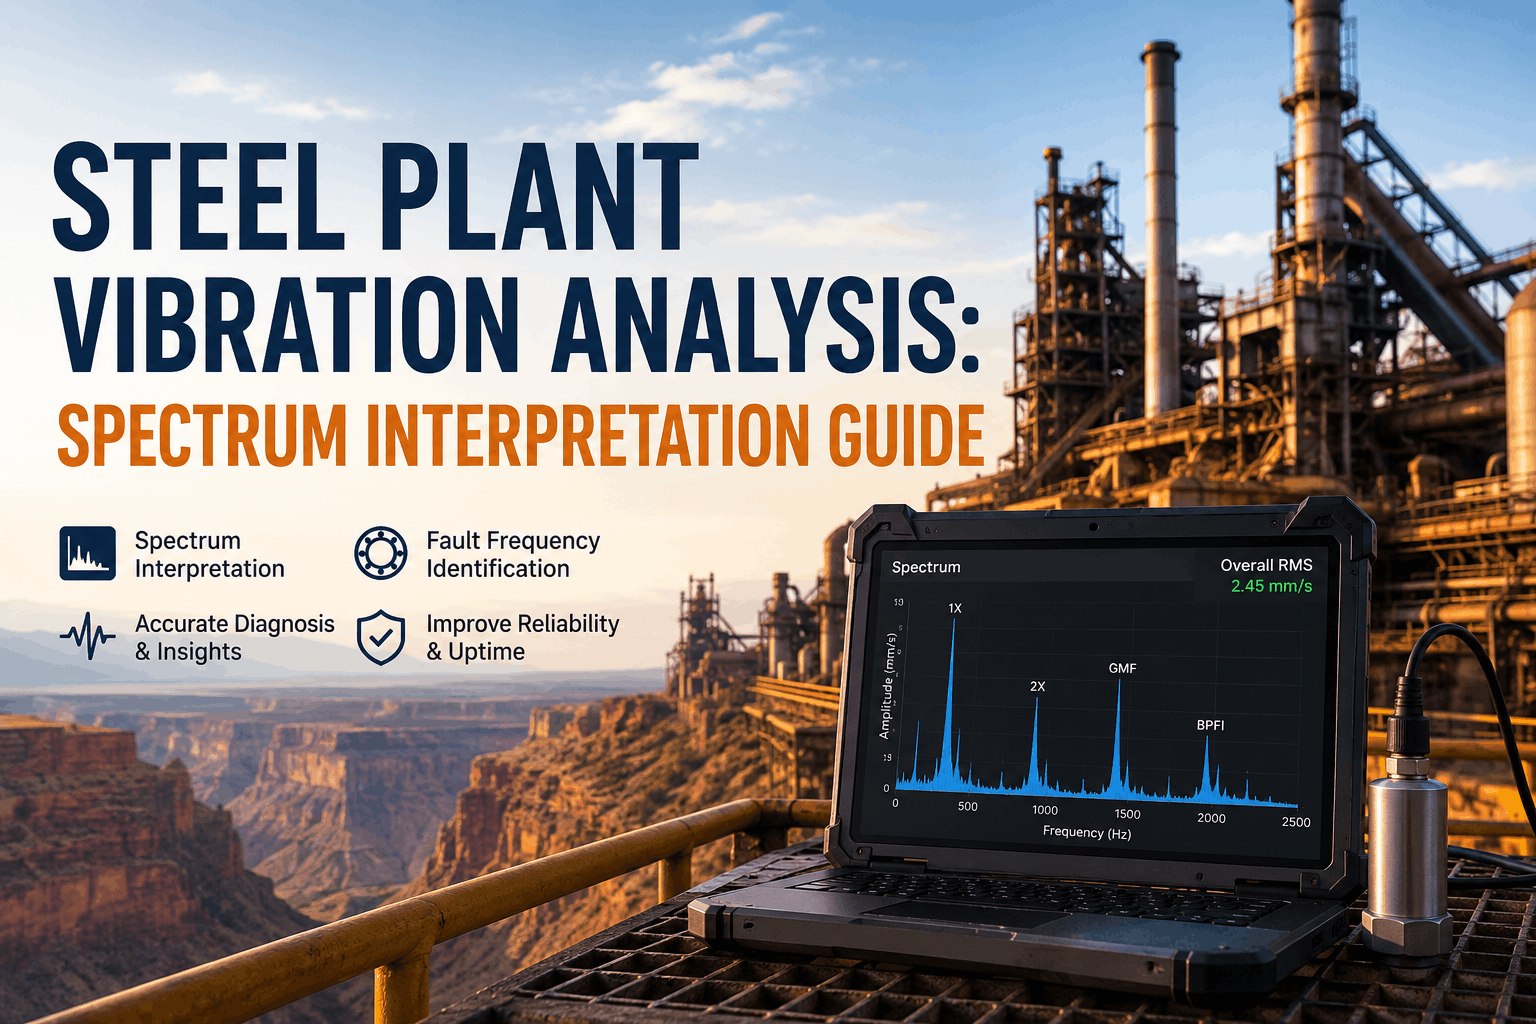
Vibration analysis reveals the signature of rotating equipment degradation through FFT spectral decomposition and time-domain waveform analysis. Every rotating machine—motors, pumps, fans, gearboxes—generates characteristic vibration patterns at frequencies directly related to their operating speed and mechanical condition. A healthy bearing produces broadband background noise at low amplitude; a spalled bearing produces recurring impulses at precise bearing defect frequencies. A misaligned shaft generates high amplitude at 1X shaft speed (synchronous); loose bolts produce sub-harmonic energy peaks that spike during load changes. Technicians trained to interpret vibration spectra extract this diagnostic intelligence from sensors, convert raw data into maintenance decisions, and catch bearing failures 4-8 weeks before catastrophic seizure. Steel plants that systematize vibration analysis prevent 60-80% of rotating equipment failures while extending motor, pump, and gearbox life 2-3 years beyond reactive maintenance baseline.
Convert Vibration Data Into Predictive Equipment Diagnostics
OxMaint vibration analysis module automatically calculates bearing defect frequencies, gear mesh harmonics, and alarm thresholds—enabling technicians to identify failure modes from spectral data and forecast maintenance windows weeks ahead of equipment failure.
Vibration Fundamentals: From Spectral Data to Maintenance Decisions
Raw vibration acceleration is sampled at 10-50 kHz and transformed via Fast Fourier Transform into frequency domain, revealing the periodic components hidden in time-domain signal. A rolling mill motor running at 1,800 rpm (30 Hz shaft speed, or "1X") generates vibration energy at fundamental running speed (1X = 30 Hz) and harmonics (2X = 60 Hz, 3X = 90 Hz). When structural resonances exist near 3X (common for many steelwork frames), harmonic energy amplifies dramatically—creating high-amplitude peaks that appear alarming but reflect equipment mounting design rather than degradation. Trained technicians distinguish normal harmonic structure from abnormal peaks indicating bearing defects, misalignment, or looseness. OxMaint FFT analysis automatically overlays baseline spectrum from same asset over time—highlighting new peaks or amplitude growth that indicates degradation, enabling technicians to focus on genuinely concerning spectral changes rather than constant-magnitude baseline signatures.
Rolling element bearings contain two raceways (outer and inner), rolling elements (balls or rollers), and a cage. When microscopic spalling initiates on outer raceway, the load zone passes over the defect once per shaft revolution, generating impulses at bearing outer race defect frequency (BPFO). Inner race spalling (load zone only contacts defect during shaft positions where load is applied) generates impulses at bearing inner race defect frequency (BPFI), typically 2-3x higher than outer race defect. Cage wear generates subsynchronous vibration at cage spin frequency—often 0.3-0.4x shaft speed. Steel plant rolling mill main bearings (often 50-150 mm bore diameter at 1,800 rpm) generate characteristic BPFO values of 3-8x shaft speed and BPFI values of 6-15x shaft speed. Technician seeing elevated amplitude peaks at these calculated frequencies has confirmed bearing defect diagnosis; trending these peak amplitudes over weeks shows degradation rate and enables failure time forecasting. OxMaint calculates bearing defect frequencies automatically from bearing dimensions and shaft speed, eliminating manual calculation and enabling rapid diagnosis confirmation.
Perfectly aligned shaft couplings produce vibration amplitude dominated by 1X shaft speed. When angular or parallel misalignment develops between motor and driven load, 2X and 3X shaft speed amplitudes grow dramatically—sometimes reaching 50-80% of 1X amplitude in severely misaligned systems. Misalignment increases bearing load 2-5x (accelerating bearing degradation 4-25x from fatigue perspective), drives rapid coupling deterioration, and causes premature seal failure in pumps and motors. Trending shows progression: healthy 1,800 rpm motor might show 1X = 2.0 mm/s, 2X = 0.3 mm/s, 3X = 0.2 mm/s. Developing misalignment shows 1X = 2.2 mm/s, 2X = 0.9 mm/s, 3X = 0.7 mm/s. Severe misalignment shows 1X = 2.5 mm/s, 2X = 2.1 mm/s, 3X = 1.8 mm/s. Teams catching misalignment when 2X reaches 0.7-0.9 mm/s can realign equipment within 1-2 week maintenance window; waiting until 2X reaches 2.0+ mm/s risks bearing failure during realignment downtime because misaligned bearings are already critically worn.
Gearbox vibration is dominated by gear mesh frequency (GMF) = number of teeth × shaft speed. A 60-tooth gear running at 1,200 rpm generates fundamental gear mesh frequency of 60 × 20 Hz = 1,200 Hz. Healthy gears produce clean GMF peaks with tight bandwidth. Gear tooth micropitting begins generating sideband structure around GMF—producing energy peaks at GMF ± 1X, GMF ± 2X, GMF ± 3X shaft speed. Sideband amplitude growth indicates modulation of gear mesh by shaft rotation, a signature of developing tooth surface degradation. Technician seeing growing sideband amplitudes around GMF has confirmed early-stage gear tooth damage requiring urgent intervention. Advanced analysis tracks the spread and amplitude of sidebands: narrow sideband structure with 1-2X spacing indicates surface spalling; wide sideband structure with 10+ harmonic families indicates advanced tooth fracture and imminent failure. OxMaint calculates GMF automatically and highlights sideband development—alerting technicians to tooth degradation weeks before catastrophic fracture.
Practical Vibration Measurement and Analysis for Steel Plant Rotating Equipment
Sensor Selection: Accelerometer Placement and Mounting Quality
Vibration measurement accuracy depends on sensor choice and mounting technique. Permanently-mounted accelerometers (sensitivity 100 mV/G) provide consistent baseline for trending; portable transducers (sensitivity 10-50 mV/G) offer flexibility for rapid assessment of multiple assets. Mounting location matters critically: measure at bearing housing for shaft vibration; measure at motor frame for structural resonance; measure perpendicular to expected motion direction. Secure mounting using threaded studs (best) or magnetic mounts (adequate for temporary portable measurements). Loose or adhesive mounting dampens high-frequency response and introduces measurement noise—undermining spectral quality and bearing defect frequency detection. Facility must invest in proper mounting fixtures and train technicians in mounting procedure—sloppy mounting invalidates subsequent analysis.
Sampling Parameters: Frequency Range, Resolution, and Time Duration
FFT analysis requires sampling at minimum 2x highest frequency of interest. For bearing defect detection, sample at 10-20 kHz (capturing bearing frequencies up to 4-10 kHz). For gear mesh analysis, sample at 20-50 kHz. Frequency resolution (FFT bin width) should be 0.1-0.5 Hz to resolve bearing defect peaks clearly; coarser resolution (1-5 Hz) misses subtle frequency structure. Collect 10-60 seconds of continuous data to capture enough impulses for statistical analysis. Portable analyzers should record at ≥10 kHz sample rate; don't trust sub-5 kHz equipment for bearing diagnosis. OxMaint stores raw acceleration files and enables post-collection analysis at configurable resolution—allowing technicians to perform rapid on-site screening, then deep analysis later without re-collection.
Baseline Establishment and Asset-Specific Reference Spectra Documentation
Baseline vibration spectrum collected during new equipment commissioning or known-good operational baseline should be documented for every asset. Save baseline FFT and time waveform for each measurement location and direction. Document baseline values: overall velocity RMS (mm/s), 1X amplitude (mm/s), bearing defect frequency amplitude if detectable, any known resonances or system characteristics. These baselines become reference against which all subsequent measurements are compared. Trending inherently requires baseline: trending showing "BPFO amplitude increased 50% from baseline" is diagnostic; isolated measurement showing "BPFO = 0.8 mm/s" is meaningless without context.
Measurement Route Creation and Technician Procedure Standardization
Create documented measurement routes specifying which assets to measure, measurement location on each asset (bearing housing, motor frame, pump discharge, etc.), measurement direction (horizontal, vertical, axial), frequency range required, and measurement schedule (weekly, monthly, quarterly). Routes ensure consistent measurement across technician shifts and years of operation. OxMaint route management automates schedule generation, tracks completion, and alerts technicians when measurements are overdue—preventing missed collections that break trending continuity.
FFT Analysis and Spectral Interpretation Training for Field Technicians
Field technicians operating vibration sensors need training in FFT spectral interpretation: how to identify baseline harmonic structure versus abnormal peaks; how to calculate bearing defect frequencies and recognize them in spectra; how to distinguish normal operating changes (speed variation, load variation) from equipment degradation signals. ISO 11095 vibration analyst certification is optimal; minimum in-house training should cover 40-80 hours of classroom and hands-on spectrum analysis. OxMaint automated defect frequency calculation and trend highlighting reduces analysis time but does not eliminate need for skilled interpretation—technicians still must confirm diagnosis, estimate failure timeline, and plan maintenance response.
Severity Thresholds and Automated Alert Generation Based on ISO Standards
ISO 10816 defines vibration severity zones: Zone A (good condition, <2.3 mm/s RMS) through Zone D (unacceptable, >7.1 mm/s RMS). Steel plant rotating equipment typically operates in Zones A-B; exceedance into Zone C requires urgent investigation; Zone D mandates immediate shutdown. Additionally, define asset-specific alarm thresholds for bearing defect frequencies (BPFO >0.5 mm/s = caution, >1.0 mm/s = urgent intervention required), gear mesh sidebands, and 2X/3X ratios (misalignment indication). OxMaint monitors measurements against these thresholds automatically and escalates alerts—enabling rapid response to emerging degradation.
Common Vibration Analysis Interpretation Errors and Correction
A motor mounted on a natural resonance frequency of its foundation generates high-amplitude vibration at that resonance even though the motor itself is healthy. Technician sees 3X harmonic at 2.0 mm/s, assumes degradation, requests bearing replacement. Root cause is actually structural resonance at 3X frequency amplifying normal motor vibration. Solution: compare current 3X amplitude against historical baseline—if unchanged over 6-12 months, it's resonance, not degradation. If suddenly spiked, then degradation is occurring. OxMaint baseline comparison prevents misdiagnosis by highlighting whether peaks are new or pre-existing.
Vibration analyst measures rolling mill motor: 1X = 3.0 mm/s. Checks ISO 10816 and sees "Zone B is <4.5 mm/s—we're okay." Six months later: 1X = 3.5 mm/s. A year later: 1X = 4.2 mm/s. System approaches Zone C without technician recognizing 0.2-0.4 mm/s per-month degradation trend indicating bearing failure within 2-3 months. Solution: track trending monthly. When 1X increases 0.1+ mm/s per month, escalate maintenance to catch failure within intervention window. Single absolute values obscure failure timing; trends forecast when intervention is required.
Technician lacking vibration analysis training sees broadband noise in high-frequency range (2-5 kHz) and assumes bearing damage. Advanced analyst recognizes this pattern as normal high-frequency turbulent flow noise in pumping systems or friction noise in lubrication systems—not bearing defect signature. Misdiagnosis leads to unnecessary bearing replacement. Solution: require ISO 11095 training or equivalent before field technicians attempt spectral diagnosis. Partner with external vibration consultants for 1-2 years while building internal expertise. OxMaint pattern matching and automated alerts reduce need for expert interpretation but cannot eliminate it entirely for complex cases.
Variable-speed drive motor or load-varying equipment shows vibration amplitude fluctuation with speed or load. Technician graphs amplitude versus time and sees "increasing trend" without accounting for corresponding speed increases. In reality, 1X amplitude stayed constant—it only appears to trend upward because speed increased 5-10%. Solution: normalize measurements to constant speed reference or use velocity rather than acceleration (velocity amplitude is more speed-independent). Document operating conditions (speed, load) alongside vibration measurements. When trending analysis shows combined amplitude and speed, separate components to identify genuine degradation from speed variation effects.
Loose sensor mounting, wrong frequency range selection (too low sampling rate for bearing frequencies, too high resolution causing noise amplification), or contaminated sensor connections produce noisy, unreliable spectra. Technician seeing noise-dominated spectrum assumes equipment is severely degraded and schedules major overhaul. Root cause is actually measurement error. Solution: validate sensor mounting and connection before measurement. Perform duplicate measurements at same location to verify consistency. If duplicates diverge significantly, repeat measurement after verifying sensor mounting and electrical connections.
Technician identifies bearing outer race defect frequency peak and recommends bearing replacement. Spectral analysis also shows sideband structure around gear mesh frequency indicating tooth degradation, but technician dismisses this as secondary to bearing focus. Maintenance team replaces bearing—discovering too late that gear damage is more advanced than bearing degradation. Solution: comprehensive spectral review identifying all degradation signatures before maintenance planning. OxMaint multi-parameter trending allows simultaneous monitoring of bearing health, gear mesh condition, and misalignment indicators—preventing tunnel vision on single failure mode.
Vibration Analysis ROI and Equipment Life Extension
| Equipment Class | Weekly Monitoring Cost | Average Failure Cost | Undetected Failure Cascade Cost | Annual Prevented Value |
|---|---|---|---|---|
| Rolling Mill Main Motor (>300 kW) | $150-200 | $40,000-80,000 | $100,000-300,000 | $150,000-400,000 |
| Main Drive Gearbox | $150-200 | $50,000-100,000 | $120,000-250,000 | $200,000-500,000 |
| Sintering Machine Fan Motor | $100-150 | $25,000-50,000 | $80,000-150,000 | $80,000-200,000 |
| Conveyor System Drive (Medium Criticality) | $80-120 | $15,000-30,000 | $40,000-100,000 | $40,000-120,000 |
| 15-Asset Integrated Vibration Program | $1,800-2,500/week | Prevented 8-12 major failures annually | Prevented cascading secondary damage | $800,000-2,000,000+ annually |
How OxMaint Accelerates Vibration Analysis Program Deployment
Frequently Asked Questions
What vibration amplitude should trigger maintenance action on critical steel plant equipment?
ISO 10816 Zone B/C boundary (4.5 mm/s overall velocity RMS) triggers urgent investigation; bearing defect frequency amplitude >0.8 mm/s indicates 4-6 week intervention window; misalignment 2X amplitude >60% of 1X amplitude warrants realignment scheduling. Asset-specific thresholds should account for baseline condition and operating environment.
How often should vibration measurements be collected to catch bearing failures before catastrophic degradation?
Weekly monitoring on high-consequence rotating equipment (rolling mill motors, main drives) enables detection of bearing degradation within 4-week intervention window; monthly intervals on medium-importance equipment; quarterly on low-risk machinery. Adjust frequency based on observed degradation rates: fast-degrading equipment requires weekly monitoring; stable equipment may extend to bi-weekly or monthly.
Can single vibration measurements without trending detect equipment degradation?
Single measurements show current condition against absolute standards (ISO 10816 zones) but cannot detect degradation progression without baseline comparison. Trending—comparing measurements over weeks and months—reveals degradation rates and failure timing. Optimal approach: compare current measurement against both absolute threshold and historical trending to identify new problems or accelerating degradation in previously-stable equipment.
What is the difference between bearing outer race and inner race defect frequencies?
Outer race defects (stationary raceway) produce impulses at bearing defect frequency (BPFO) typically 3-8x shaft speed, visible immediately after defect initiation. Inner race defects (rotating with shaft) produce impulses at BPFI (typically 6-15x shaft speed) and sideband structure around BPFO. Inner race degradation is typically more advanced than outer race at same bearing history—indicating longer spall development period before detectable vibration.
How does misalignment affect bearing life and why is 2X amplitude important?
Misalignment loads bearings 2-5x higher than concentric alignment, accelerating fatigue damage 4-25x. Bearing life L10 calculation uses bearing load to power 3, so 3x load increase reduces bearing life to ~3% of nominal value. 2X shaft speed amplitude growth above 60% of 1X value indicates developing misalignment approaching critical intervention window—realignment scheduling prevents catastrophic bearing failure during continued operation.
Should permanent accelerometers or portable transducers be used for routine vibration monitoring?
High-consequence equipment (>300 kW motors, main gearboxes) benefits from permanent accelerometers enabling continuous or scheduled automated monitoring with consistent baseline; portable transducers offer flexibility for multi-asset routes covering 20-40 machines weekly. Hybrid approach: permanent sensors on 5-10 critical assets, portable collection on 15-30 medium-importance equipment. OxMaint supports both modalities with unified trending and alerting.
What training do technicians need to interpret vibration spectra accurately?
Optimal: ISO 11095 vibration analyst certification (typically 40-80 hours classroom plus 100-200 hours hands-on experience). Minimum: in-house training covering 50-100 hours including FFT principles, bearing defect frequency calculation, baseline comparison, severity threshold interpretation, and asset-specific troubleshooting. OxMaint automated analysis reduces interpretation complexity but does not eliminate need for skilled analysts reviewing alarms and confirming diagnoses.
How can mounted equipment be distinguished from equipment degradation in vibration trending?
Compare current 1X and harmonic amplitudes against documented baseline—if identical over multiple measurement intervals, baseline resonance or mounting characteristic is unchanged. If 1X and harmonics increase together consistently, degradation is likely. Speed normalization and load accounting help: trending 1X amplitude at constant speed and load eliminates operational variation from equipment degradation diagnosis.
Real World: How a Steel Plant Prevented $1.8M in Cascading Failures Through Vibration Monitoring
"Our rolling mill experienced catastrophic gearbox failure—the main drive shaft bearing seized during production, damaging not just the bearing but the gear teeth and the connected motor rotor. Replacement and secondary damage correction cost over $300,000 and took 6 weeks of emergency repair. We analyzed failure cause and discovered the bearing had been degrading for 10+ weeks before failure—bearing defect frequencies were present in maintenance records from months before if we had analyzed them. We implemented OxMaint vibration monitoring on all 12 critical rotating assets. Within the first month, we identified BPFO amplitude growing on the blast furnace main fan bearing—a growth pattern indicating 6-8 week failure timeline if uncorrected. We scheduled bearing replacement during planned downtime, preventing what would have become another $250,000+ emergency failure. Over 18 months, condition monitoring prevented 5 similar cascading failures—each one saving $150,000-$300,000 in emergency costs and secondary damage. More importantly, we shifted from reactive firefighting to predictable maintenance, which improved technician morale and allowed planning of maintenance during scheduled downtime rather than emergency night shifts." — Plant Engineering Manager, Midwest Integrated Steel Mill
Transform Vibration Data Into Equipment Intelligence
OxMaint vibration analysis module automates bearing defect frequency detection, baseline comparison, and trending visualization—enabling rapid diagnosis of rotating equipment degradation and coordinated maintenance intervention before failures cascade into secondary damage.