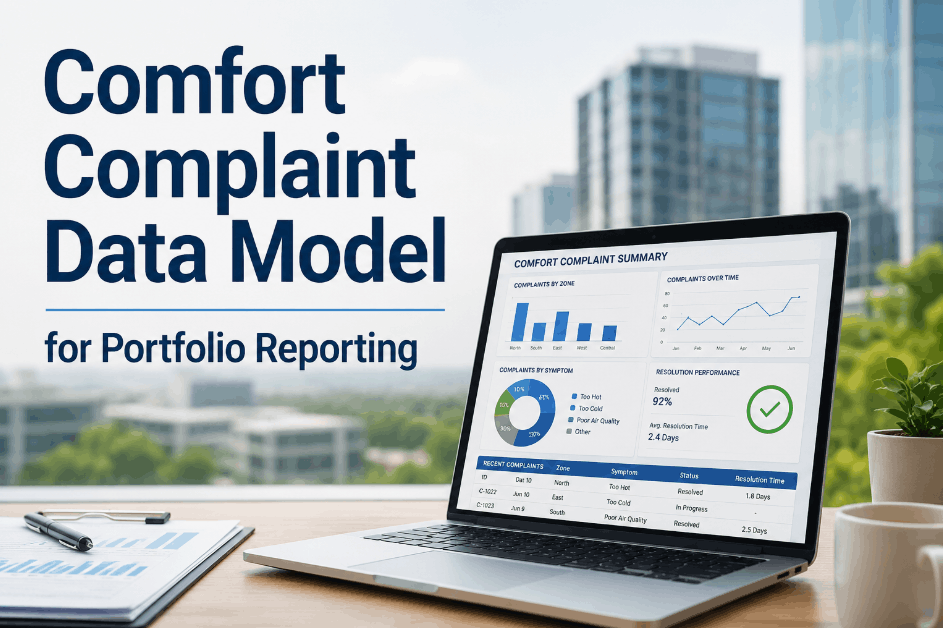
Comfort complaints generate service calls. But without a structured data model, those calls remain isolated events — preventing facility managers from seeing the zone patterns, time-of-day trends, and recurring symptom clusters that reveal systemic HVAC problems across an entire portfolio. Sign Up Free on Oxmaint to structure complaint intake, classify symptoms by zone and time, and build the portfolio-wide reporting that turns scattered service requests into operational intelligence.
Why Comfort Complaints Require a Data Model — Not Just a Ticketing System
A ticketing system captures individual complaints. A data model makes those complaints comparable — enabling facility teams to answer questions that individual tickets can't: Which zones generate the most complaints per square foot? Do temperature complaints cluster in the afternoon or at morning occupancy? Is the same symptom appearing across multiple buildings simultaneously? Book a Demo to see how Oxmaint's complaint classification structure turns service request data into portfolio-level insight that reduces recurring comfort issues instead of just resolving them one at a time.
Four Core Dimensions of a Comfort Complaint Data Model
Sign Up Free on Oxmaint to configure structured complaint intake forms that capture all four data dimensions — enabling the zone, time, symptom, and resolution classification that turns complaint volume into actionable portfolio intelligence.
Every complaint must be linked to a specific zone, floor, and building — not just a building address. Zone-level classification reveals which VAV boxes, AHUs, or building sections are chronic underperformers versus isolated incidents, enabling targeted investigation rather than portfolio-wide system changes.
Complaints are not uniformly distributed across the day or year. Time classification exposes control logic failures — a zone that generates complaints only between 1–4 PM points to afternoon solar gain without adequate reset logic, not to equipment failure. Without time data, that distinction is invisible.
Free-text complaint descriptions cannot be compared across buildings or time periods. Standardized symptom categories — too hot, too cold, poor airflow, humidity, drafts, noise, odors — enable statistical analysis that identifies the dominant complaint type in each zone and drives the right maintenance response rather than generalized HVAC inspection.
Tracking what resolved each complaint — controls adjustment, equipment repair, PM catch-up, or occupant education — reveals which interventions produce lasting improvement versus temporary relief. Resolution data closes the feedback loop that allows portfolio managers to evaluate whether root causes are being addressed or merely symptoms are being suppressed.
Comfort Complaint Classification Matrix for Portfolio Analysis
Complaint classification must be consistent across every building in the portfolio to enable meaningful comparison. Book a Demo to see how Oxmaint's standardized complaint taxonomy applies across multiple facilities — making portfolio analysis possible without manual data normalization.
| Symptom Category | Common Time Pattern | Likely Root Cause | Investigation Priority | Oxmaint Action |
|---|---|---|---|---|
| Too Hot — Perimeter Zone | Afternoon peak (1–5 PM) | Solar gain, insufficient reset, VAV underperformance | High — occupant productivity impact | Zone-specific trend WO with controls review |
| Too Cold — Interior Zone | Morning occupancy (7–10 AM) | Setback recovery lag, VAV minimum airflow excess | Medium — comfort recovery typically rapid | Setback schedule audit WO |
| Poor Airflow / Stuffiness | Sustained across occupied hours | Filter fouling, damper malfunction, duct restriction | High — IAQ and ventilation compliance risk | Airflow inspection WO with filter replacement |
| High Humidity / Dampness | Seasonal (summer peak) | Dehumidification underperformance, ERV bypass fault | High — mold risk in sustained conditions | Dehumidification system inspection WO |
| Drafts / Cold Air Blow | All occupied hours | Diffuser misdirection, excessive supply velocity, VAV min set too high | Medium — occupant comfort only | Diffuser balance and VAV min setpoint review |
Implementing a Comfort Complaint Data Model with Oxmaint
Configure Structured Complaint Intake Forms with Required Classification Fields
Oxmaint complaint work orders capture zone, floor, building, time of occurrence, symptom category, and occupant impact at intake — before technician dispatch. Structured intake ensures data model completeness from the first point of contact, not after the service visit when recall accuracy drops.
Link Complaints to Asset and Zone Records for Trend Attribution
Each complaint is linked to the specific HVAC asset — VAV box, AHU, chiller — serving the affected zone. Asset-level linkage enables complaint volume to be attributed to equipment performance, not just location — surfacing which assets are generating disproportionate complaint volume relative to their service area.
Classify Resolution Actions to Track Intervention Effectiveness
Technicians close complaints with a standardized resolution code — controls adjustment, equipment repair, PM deficiency corrected, or no fault found. Resolution classification enables analysis of which maintenance actions deliver lasting complaint reduction versus which zones are generating repeat service calls without sustained improvement.
Run Zone and Time Pattern Analysis to Identify Systemic Issues
Oxmaint analytics surfaces complaint hotspots by zone density, time-of-day clustering, and symptom type distribution — enabling facility managers to distinguish isolated incidents from systemic HVAC performance failures that require investigation beyond individual work orders.
Report Portfolio Comfort Metrics to Operations Leadership and Procurement
Oxmaint aggregates complaint volume, zone hotspot rankings, symptom distribution, and resolution effectiveness across every building — enabling portfolio reporting that justifies capital investment in chronically underperforming zones and demonstrates operational improvement from maintenance program changes.
Comfort Complaint Portfolio Reporting KPIs
Normalizes complaint volume by building area — enabling fair comparison across buildings of different sizes. Rising rates in a specific building flag systemic HVAC performance decline before comfort impacts reach formal escalation.
Measures zones that generated a second complaint within 30 days of the first resolution. High repeat rates confirm the initial resolution addressed symptoms without root cause — the primary signal that deeper investigation or capital repair is needed.
Tracks time from complaint submission to technician resolution confirmation. Long resolution times in specific symptom categories indicate dispatch mismatches — technicians arriving without the right skills or tools to address the classified complaint type.
Identifies whether a portfolio-wide symptom pattern — widespread stuffiness, humidity complaints, afternoon heat — indicates a systemic controls or equipment issue requiring coordinated response versus isolated building-level problems.
Measures what percentage of resolved complaints were traceable to a maintenance deficiency — filter overdue, damper uncalibrated, controls drifted. High correlation rates confirm that PM compliance improvement will directly reduce complaint volume in subsequent quarters.
High no-fault-found rates indicate complaints are being closed without investigation — or that complaint intake classification is too imprecise to guide technicians to the correct fault location. Both require intake form or dispatch process correction, not just complaint volume management.