The call comes at 2 AM. A conveyor stops. A pump fails. A drive gives out. The maintenance technician checks the storeroom and the part is not there. The OEM quotes eight weeks on expedited delivery. Two weeks if a local shop can reverse-engineer it. Meanwhile, production is down — and every hour costs between £50,000 and £150,000 depending on the line. Critical spare parts analysis exists to prevent exactly this. It is a structured method to answer one question before the failure happens: which parts, if missing when needed, will cause the most damage — and are they on the shelf? Sign up free on OxMaint to link criticality classifications directly to your asset and parts inventory — or book a demo to see how reliability teams use it across multi-site operations.
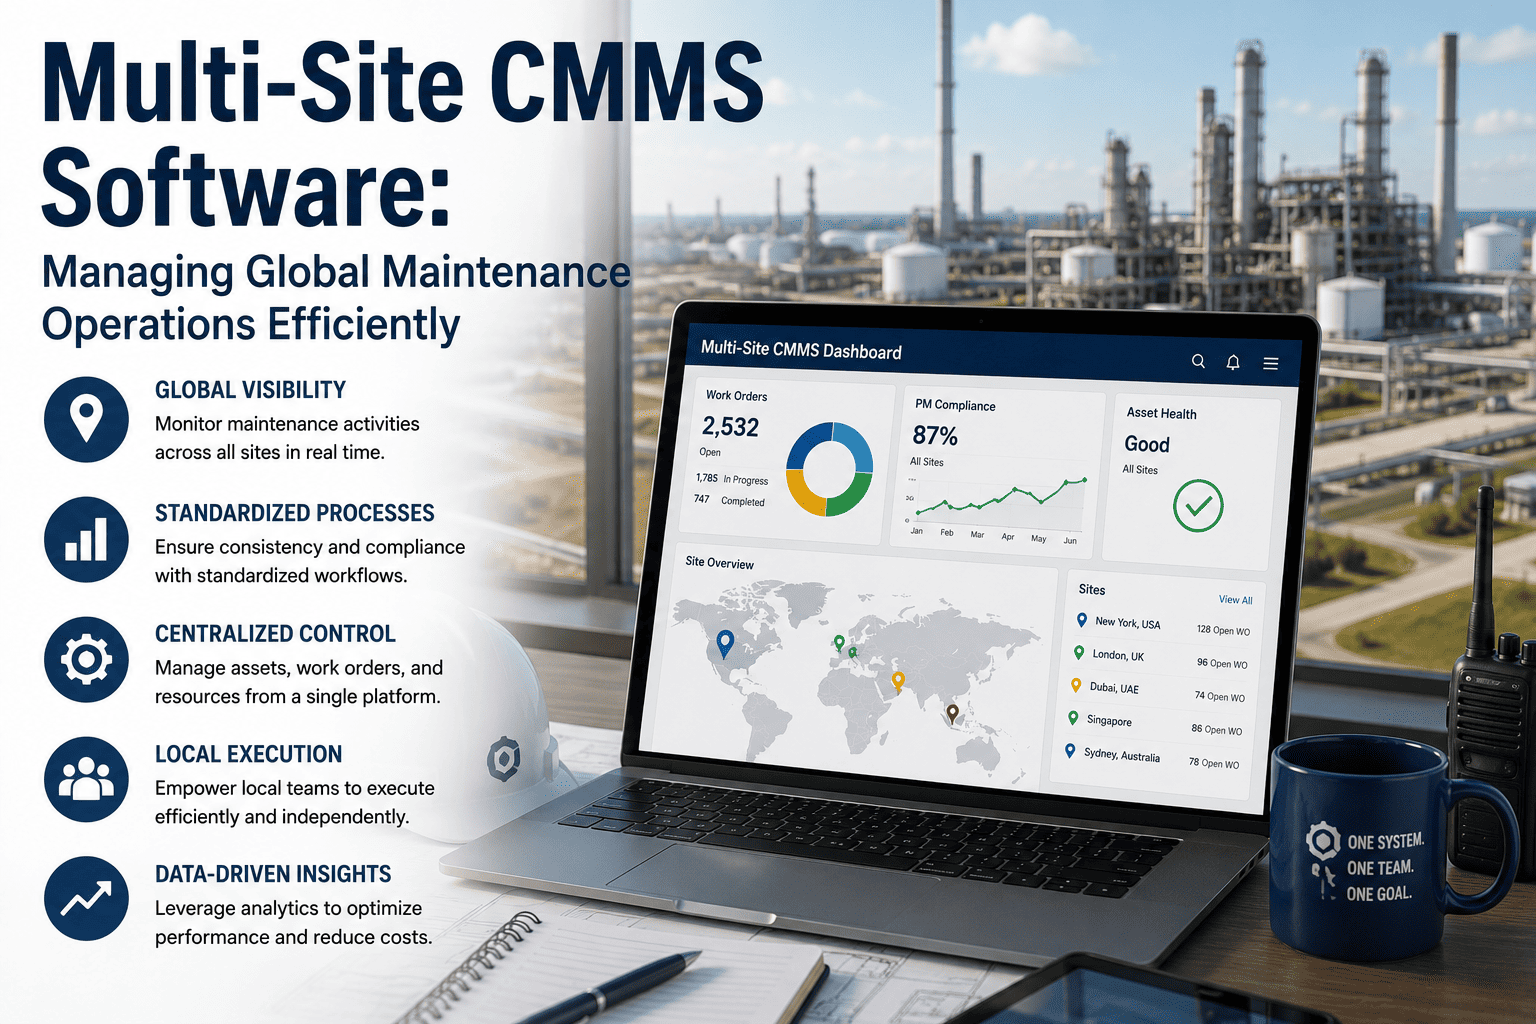
Criticality Analysis Built Into Your Parts Inventory
OxMaint links every spare part to its equipment record, supports ABC-VED criticality classification, tracks last movement and reorder points, and alerts you before critical parts go below minimum stock — no separate spreadsheet required.
What Critical Spare Parts Analysis Actually Is
Critical spare parts analysis is a systematic evaluation of every part in your inventory across multiple risk dimensions — production impact, lead time, failure probability, substitutability, and supply chain risk. The output is a scored, tiered classification that tells your team which parts need to be on the shelf at all times, which can be procured on demand, and which are being over-stocked relative to their actual risk.
WITHOUT IT
All Parts Treated Equally
Over-stocked on low-risk consumables. Under-stocked on the one bearing that stops a production line for three weeks. Both problems coexist.
THE GOAL
Risk-Matched Stocking
Every part stocked at a level proportional to the consequence of its absence. Critical parts always on the shelf. Non-critical parts procured on demand.
THE RESULT
Higher Reliability, Lower Cost
Best-in-class facilities achieve 98% service levels while holding 23% less inventory by using criticality-driven stocking rather than fixed reorder points.
The Three Classification Frameworks Every Reliability Team Should Know
No single framework captures the full picture. The most effective criticality programmes combine three complementary lenses to produce a multi-dimensional score per part. Sign up on OxMaint to apply ABC-VED classification directly inside your parts inventory, linked to your equipment records.
Framework
What It Measures
Categories
Primary Use
VED Analysis
Operational impact if the part is unavailable — production, safety, and environmental consequences
Vital — cannot run without it
Essential — workaround possible
Desirable — minimal impact
Determines stocking priority regardless of cost
ABC Analysis
Annual consumption value — how much does this part cost and how often is it used
A — top 10% of parts, 70–80% of spend
B — mid-tier
C — majority of SKUs, low spend
Determines inventory control intensity and reorder review frequency
XYZ Analysis
Demand variability — how predictably is this part consumed over time
X — constant, predictable demand
Y — seasonal or variable
Z — random, unpredictable demand
Determines safety stock calculation and forecasting method
Why you need all three together
A Vital-A-Z part is high operational impact, high value, and unpredictable demand — the most dangerous combination. It requires maximum safety stock and justifies keeping two units on hand despite low turnover. A Desirable-C-X part is low impact, low cost, and predictable — procure on demand and remove from your storeroom entirely. Combining all three into a matrix creates 27 segments. In practice, 8 to 12 segments with distinct stocking policies are sufficient to cover most manufacturing inventory profiles.
The Five Scoring Factors in a Criticality Assessment
A criticality score is produced by rating each part across five risk factors on a 1–5 scale, weighting by importance to your operation, and summing to a total. Parts scoring above 80 out of 100 are typically classified Critical. 50–79 are Semi-Critical. Below 50 are Non-Critical. Book a demo to see how OxMaint stores and applies criticality scores per part across your asset register.
1
Impact of Failure on Production
Weight: 30–40%
Does failure of this part halt the entire production line, a single cell, or have no production impact? Score 5 if total line stoppage; 3 if partial impact with workaround; 1 if no production consequence. This is the highest-weighted factor in most scoring models.
2
Lead Time to Procure
Weight: 20–25%
How long from raising a purchase order to installation of the part? Score 5 for parts with lead times exceeding 12 weeks or requiring custom manufacture; 3 for 4–12 weeks; 1 for next-day availability from local stock. Parts with short lead times and local availability do not need safety stock — they can be procured on demand.
3
Probability of Failure (MTBF)
Weight: 15–20%
Based on historical MTBF data or manufacturer specifications, how likely is this part to fail within your planning horizon? Parts with short MTBF relative to their lead time are the highest-risk combinations — a part that fails every 6 months and takes 8 weeks to procure must always be on the shelf.
4
Substitutability and Interchangeability
Weight: 10–15%
Can a different but compatible part be used in an emergency? Is the part available from multiple sources or is it single-sourced from one manufacturer? Score 5 for parts that are proprietary, custom, or single-sourced with no viable substitute; 1 for standard catalogue parts available from multiple suppliers.
5
Safety and Compliance Consequence
Weight: 10–15%
Does failure of this part create a safety risk, an environmental incident, or a regulatory compliance breach? Parts whose absence forces a process to operate in an unsafe or non-compliant condition must be treated as Critical regardless of their score on other factors.
Step-by-Step: Running a Critical Spare Parts Analysis
A thorough criticality analysis for a facility with 1,000 to 5,000 active parts typically takes two to six weeks depending on data availability. The quality of the output depends entirely on the quality of the inputs — MTBF data, actual lead times, and real consumption history. Sign up free on OxMaint to store all of this data against your equipment records and run the analysis with current information rather than historical guesswork.
Phase
What You Do
Key Output
1
Build the equipment criticality register
Rank all assets by production impact. A failure on a bottleneck machine that has no bypass is a higher base criticality than a parallel machine with standby capacity. This ranking flows down to every part associated with each asset.
2
Compile the parts master data
For each part: part number, description, linked equipment, current stock quantity, unit cost, lead time, MTBF (where available), last-movement date, and supplier source count. Clean and deduplicated data at this stage prevents errors in every scoring step that follows.
3
Apply VED, ABC, and XYZ scoring
Rate each part on the five scoring factors. Apply VED based on operational impact. Apply ABC based on annual consumption value. Apply XYZ based on demand variability from consumption history. Each part now has a three-dimensional classification.
4
Plot on the criticality-supply risk matrix
Map each part against two axes: equipment criticality (what happens if this part is missing) and supply chain risk (how hard is it to get). Parts in the top-right quadrant — high criticality and high supply risk — get insurance stocking at 100% availability, regardless of carrying cost.
5
Assign stocking policies per tier
Critical parts: minimum one unit on-site always, two units for lead times exceeding 12 weeks. Semi-critical: safety stock calculated from lead time and failure rate. Non-critical: procure on demand, no storeroom holding. Each policy triggers its own reorder logic and alert threshold.
6
Schedule annual re-assessment
Criticality scores assigned in one year drive procurement in the next — and can become dangerously stale. Vendor changes, equipment modifications, and market shifts must feed back into the classification. An annual review cycle with triggered reassessment when equipment status changes is the minimum standard.
Stocking Policies by Criticality Tier
The classification is only useful if it translates directly into stocking rules. This is the framework most reliability teams use as a starting point, adapted to the specific lead times and failure profiles of their asset base.
Insurance Stocking
Minimum one unit on-site at all times. Two units if lead time exceeds 12 weeks. Reorder triggered the moment stock falls to minimum — not when stock reaches zero. Weekly stock visibility check.
Semi-Critical — Score 50–79
Safety Stock with Min-Max
Safety stock calculated from lead time variability and failure probability. Min-max reorder points set from consumption history. Monthly review. For critical spares use Z-score of 2.33 — targeting 99% service level.
Non-Critical — Score Below 50
Procure on Demand
No storeroom holding. Catalogued from approved suppliers with defined lead times acceptable for the asset class. Quarterly review of classification to confirm non-critical status has not changed. Any holding identified as obsolete — clear.
The Most Common Mistakes in Criticality Analysis
01
Scoring from memory rather than data
MTBF estimated from institutional knowledge rather than actual failure history. Lead times assumed from purchase orders years old rather than current supplier quotes. Scores built on assumptions erode in reliability within 12 months.
02
Treating all assets as equally critical
A single-threaded bottleneck machine with no bypass is categorically different from a parallel machine with standby capacity. Parts associated with the former need higher scores on the production impact factor, regardless of other attributes.
03
Never updating the classification
Criticality assigned in 2019 still driving procurement in 2026. Vendor changes, BOM updates, plant modifications, and market shifts are never fed back into the classification — creating hidden stockout risks for parts whose supply chain has changed significantly.
04
Using a single framework instead of combining them
ABC alone over-stocks expensive consumables and under-stocks cheap but vital parts. VED alone ignores value, creating bloated stocking of low-cost items. XYZ alone cannot distinguish between a cheap bearing and an expensive custom impeller with the same demand pattern. All three are needed.
Frequently Asked Questions
What is the difference between a critical spare and an insurance spare?
The terms are often used interchangeably but have a technical distinction. A critical spare is any part classified at the highest criticality tier — its absence causes significant production, safety, or compliance impact. An insurance spare specifically refers to a high-value, low-turnover part (such as a large motor, gearbox, or transformer) held solely because the consequence and lead time of not having it justifies the carrying cost. All insurance spares are critical spares, but not all critical spares are insurance spares. Sign up free on OxMaint to classify and track both categories in your parts inventory.
How often should a criticality analysis be reviewed?
At a minimum, annually — with triggered reassessment whenever equipment status changes (retirement, modification, new installation) or when a supplier changes lead times significantly. A part that was non-critical when it could be sourced in three days from a local supplier becomes semi-critical if that supplier is removed from the approved vendor list and the nearest alternative quotes six weeks. The analysis must be a living document, not a one-time project. Book a demo to see how OxMaint triggers reassessment automatically when equipment status changes.
How does criticality analysis reduce inventory costs without increasing stockout risk?
By concentrating stock on parts where the consequence of absence is highest — and eliminating stock on parts where the consequence is low and procurement is fast. In practice, most facilities discover they are over-stocked on low-risk consumables and under-stocked on a handful of high-risk components. Redistributing the inventory investment using criticality scores consistently produces lower total carrying costs and higher service levels simultaneously. Best-in-class facilities achieve 98% service levels while holding 23% less inventory than average performers.
What data do I need to start a criticality analysis?
At a minimum: a clean parts master with part numbers, descriptions, and linked equipment; current stock quantities and unit costs; actual lead times from recent purchase orders or supplier quotes; and consumption history for at least the past 12 months. MTBF data from maintenance records significantly improves the scoring quality for the failure probability factor. If MTBF is not available, manufacturer specifications or generic reliability data for the component type can be used as a starting point. Sign up free on OxMaint to consolidate this data in one system and run your first criticality review from current records.
Know Which Parts Must Always Be on the Shelf
OxMaint links every spare part to its equipment record, stores criticality classifications, tracks stock levels and last movement, and alerts your team before critical parts fall below minimum — all connected to your work orders and maintenance history. Start free, no hardware required.