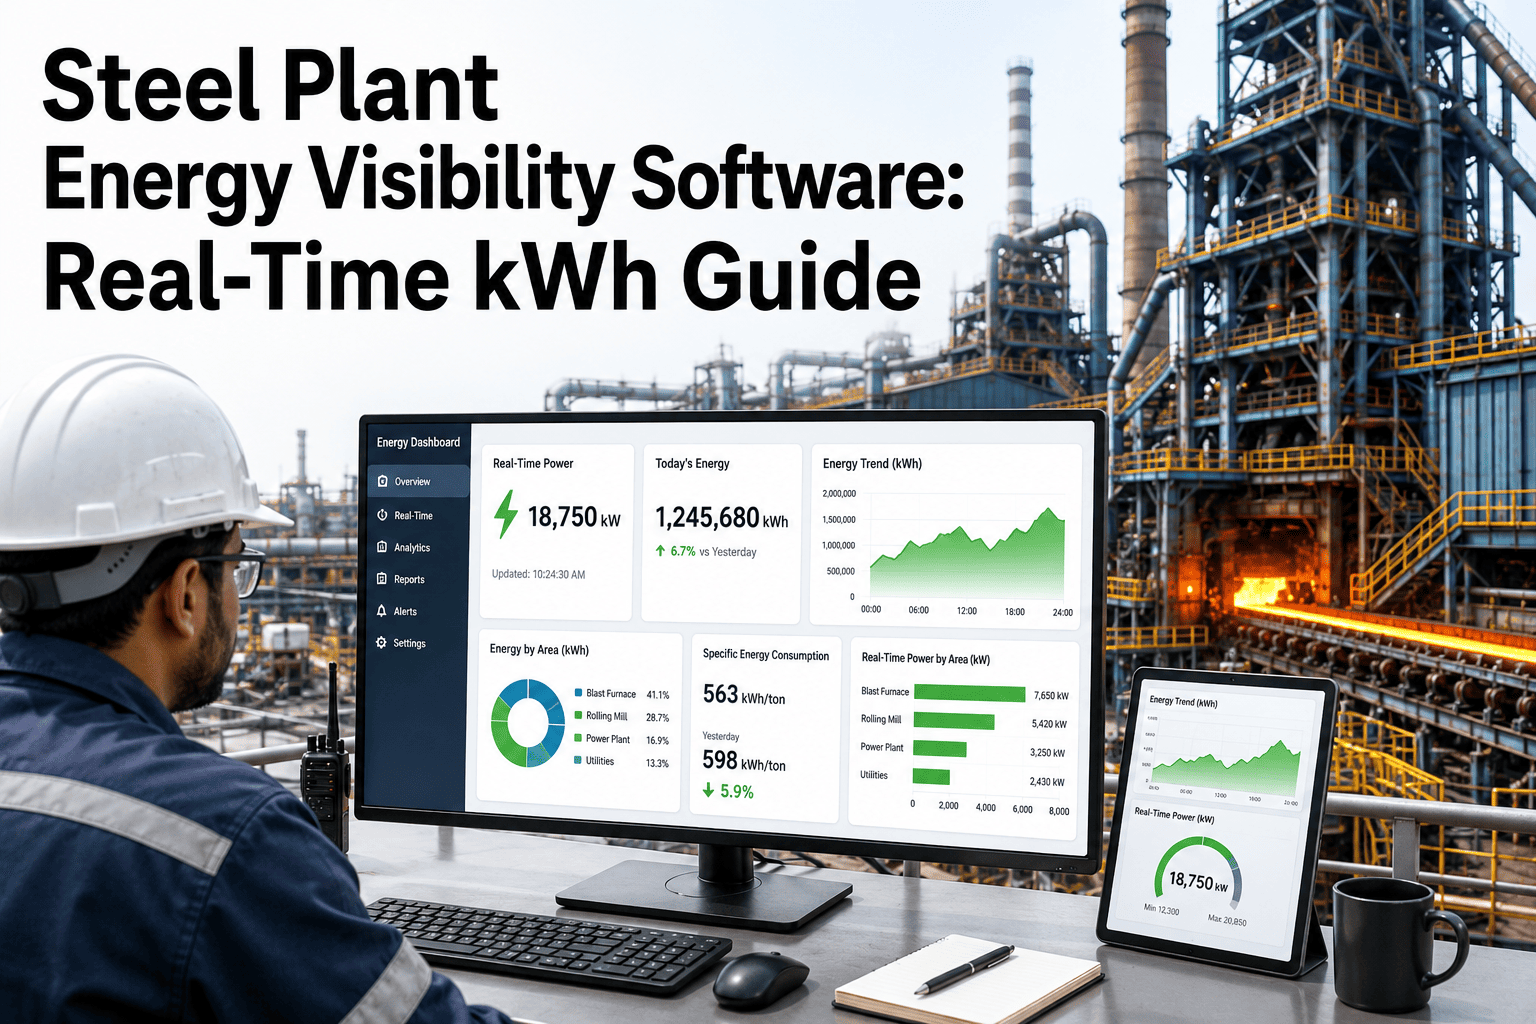
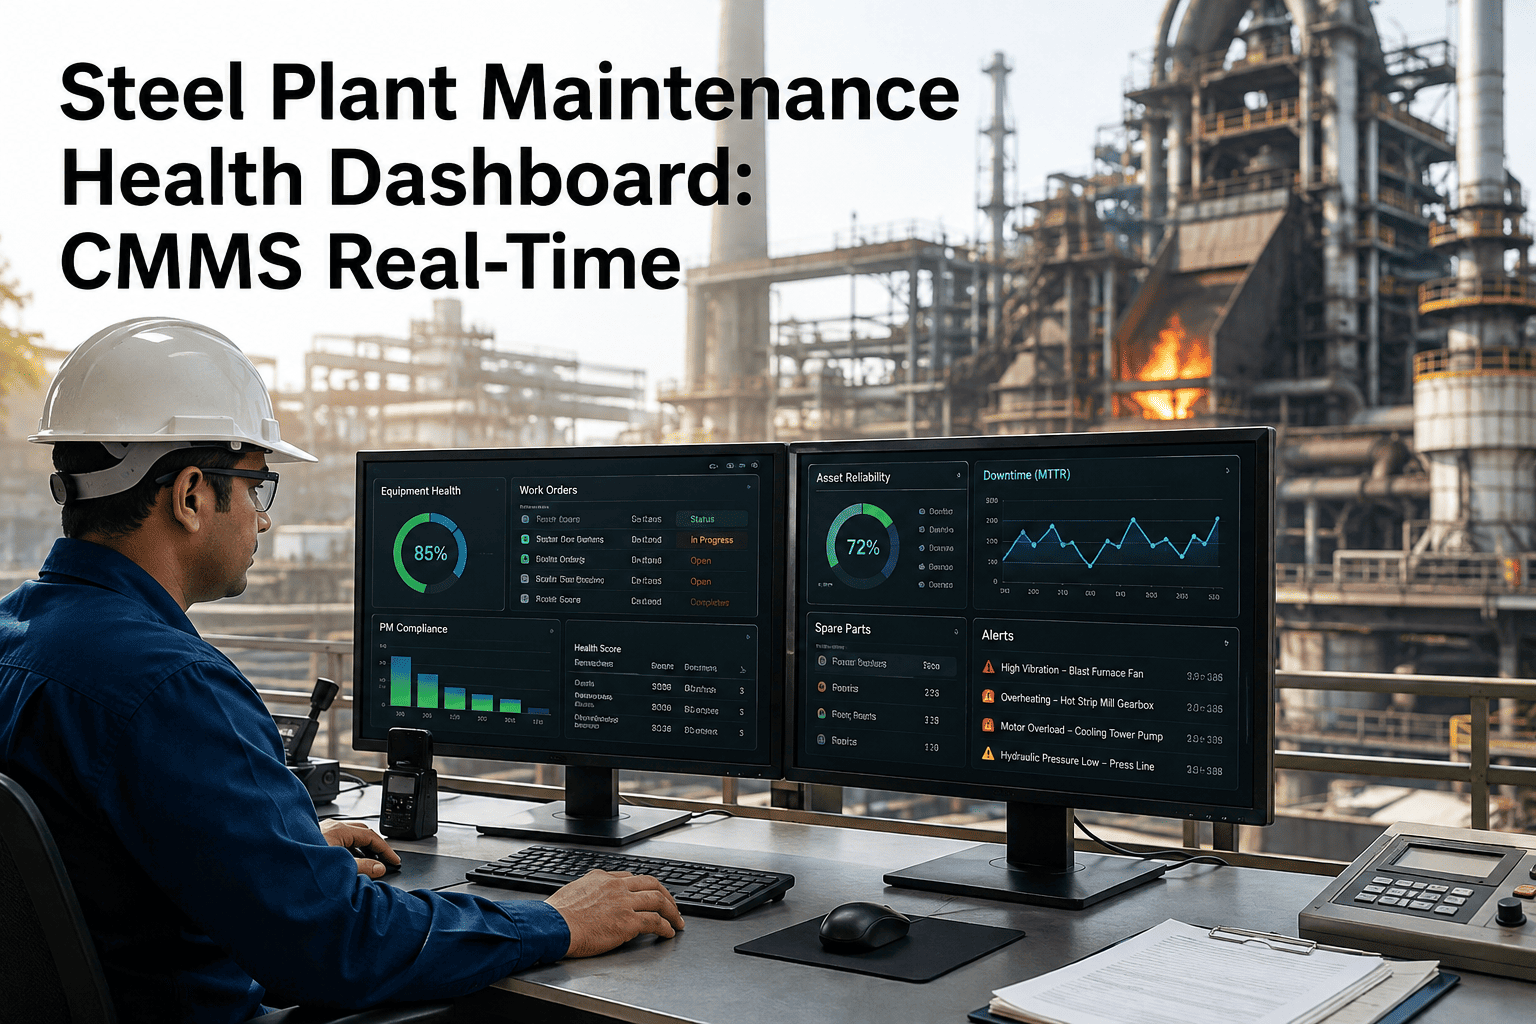
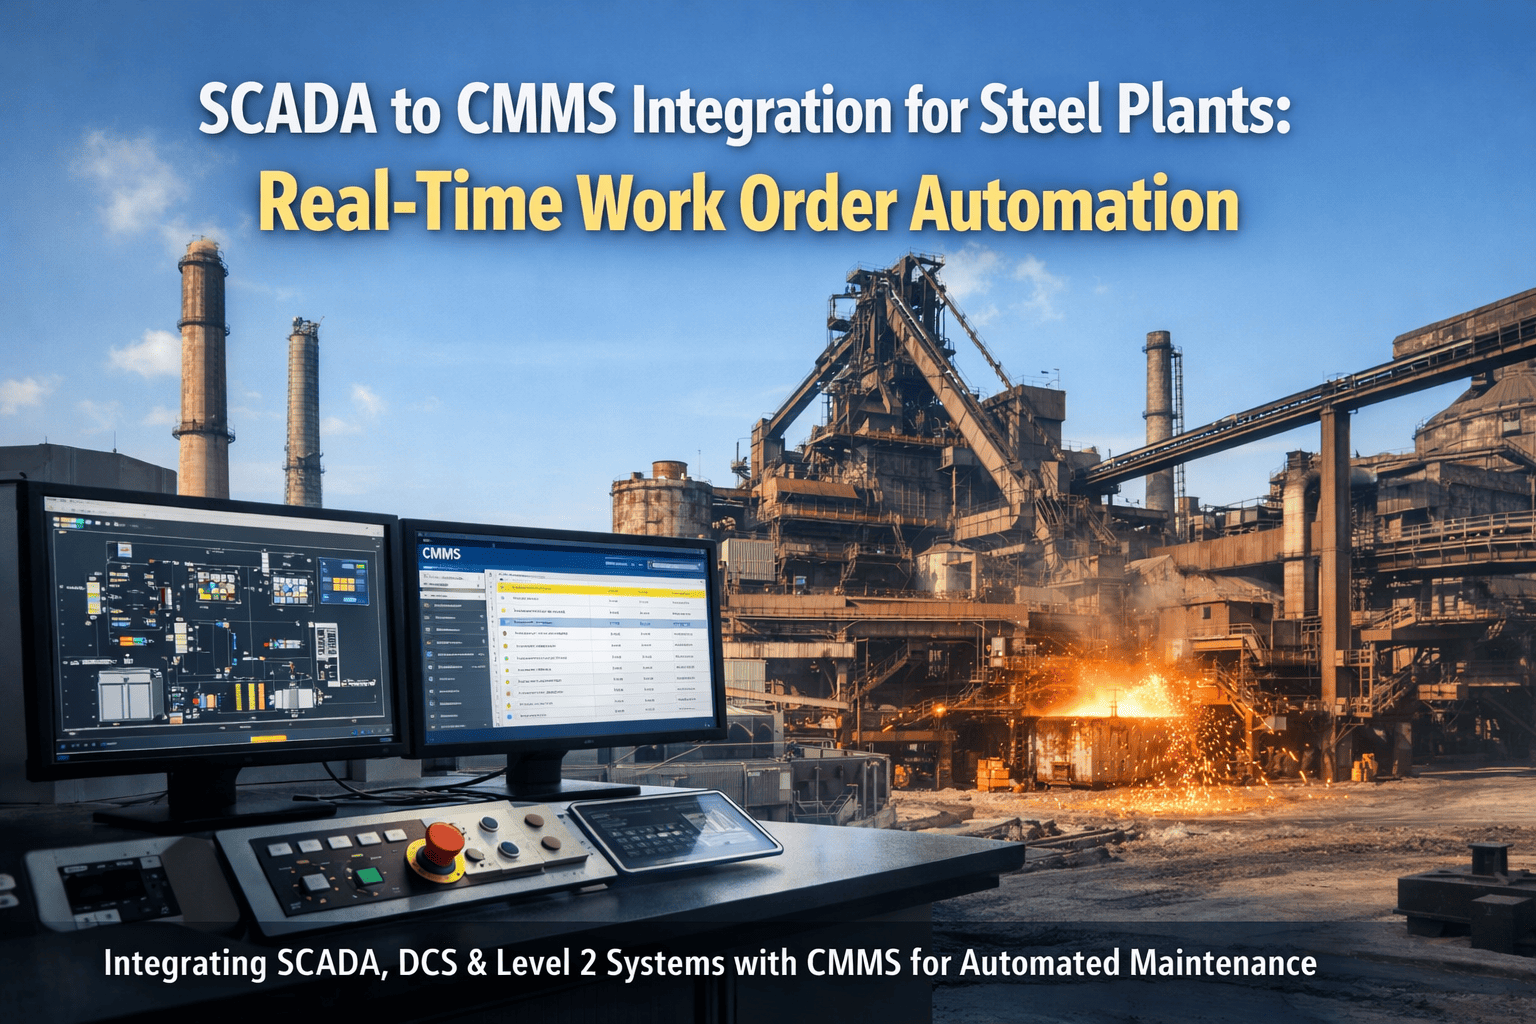
Every steel plant generates a flood of live data every shift — furnace temperatures, mill speeds, energy draw, and quality results — yet most plant managers still walk the floor or wait for a phone call to learn what is happening right now. Production numbers sit in the SCADA historian, maintenance status sits in the CMMS, energy readings sit on a separate meter panel, and quality results land in a spreadsheet once a shift, so by the time all four reach one desk the window to act has usually closed. A real-time operations dashboard removes this lag by pulling production, maintenance, energy, and quality data onto one live screen, and plants that build this view on a connected CMMS platform cut shift-level decision delay from hours to minutes.
Real-Time Plant Visibility
One Screen for Production, Maintenance, Energy and Quality
Stop hopping between four systems every hour. See line status, open work orders, energy draw, and yield the moment they change, from any device on the floor or in the office.
1
3.4 hrs
lost per shift chasing data across separate systems before a single dashboard is put in place
2
68%
of mid-size steel plants still rely on whiteboards or spreadsheets for shift handover notes
3
45%
faster response to line stoppages once production, maintenance, and energy data share one screen
Why Steel Plants Are Moving to a Single Real-Time View
In a typical rolling mill or integrated plant, four departments track four different truths. The production team watches tons per hour on the SCADA historian. The maintenance team watches open work orders and equipment status in the CMMS. The energy team watches transformer load and gas consumption on a separate metering system. The quality team watches yield, rejects, and downgrades in a lab log that updates once or twice a shift. None of these systems talk to each other, so when a rolling mill slows down, the plant manager has to call three people before understanding whether the cause is a jammed pass, a bearing alarm, a power dip, or a quality hold. A real-time operations dashboard collapses this into one continuously refreshed view, so the cause of a slowdown is visible in seconds rather than after a round of phone calls. The value compounds across a shift: supervisors catch small deviations before they become downtime, and general managers walk into a morning meeting already knowing what happened overnight instead of waiting for someone to compile a report.
01
Production Line Status Panel
Live tons-per-hour, line speed, and current product grade for every rolling stand or furnace, refreshed directly from the SCADA historian so supervisors see the same numbers as the control room.
Maintenance and Downtime Tracker
02
Open work orders, active alarms, and equipment status pulled from the CMMS in real time, tagged by line and asset so a stoppage cause is visible the moment it is logged.
03
Energy Consumption Monitor
Transformer load, furnace gas consumption, and compressed air usage trended against production volume, flagging when energy per ton drifts above the plant's normal range.
Quality and Yield Panel
04
First-time-right percentage, rework volume, and downgrade counts updated as lab results are entered, so quality drift shows up during the shift instead of the next morning.
05
Shift Handover Log
A running, time-stamped log of events, open issues, and completed actions that replaces the whiteboard, so the incoming shift starts with full context instead of a verbal summary.
Single View, Every Shift
Give Every Shift the Same Picture, Automatically
A dashboard built on live CMMS, SCADA, energy, and quality feeds means no more waiting for a report to know what is happening on the floor right now.
Building the Dashboard: Data Sources and Architecture
A real-time dashboard is only as good as the data feeding it, so the build starts with mapping every source system before a single screen is designed. Production data comes from the SCADA historian or PLC network through a standard OPC-UA or Modbus connection, giving line speed, tonnage, and stoppage codes. Maintenance data comes directly from the CMMS work order queue, asset status, and open alarm list, so a stoppage on the floor is automatically linked to the work order created for it. Energy data comes from plant meters or a building management system, normalized to energy-per-ton so it can be compared against production output. Quality data comes from the lab information system or manual entry forms, feeding first-time-right percentage and rework counts as soon as a test result is logged. Once these feeds are mapped, the dashboard layer applies role-based views: a general manager sees plant-wide KPIs, a shift supervisor sees only their line, and a maintenance manager sees open work orders and equipment health, all drawn from the same underlying data so no two departments are ever looking at different numbers.
Phase 1: Data Source Mapping and Integration
ScopeIdentify SCADA, CMMS, energy meter, and quality feeds for priority lines
ConnectionsOPC-UA or Modbus link for production; API link for CMMS and lab systems
Duration2 to 4 weeks depending on number of source systems
Phase 2: Dashboard and Role-Based View Configuration
ViewsGM plant-wide view, shift supervisor line view, maintenance manager work-order view
AlertsThreshold-based alerts for stoppage duration, energy drift, and quality drops
Duration2 to 3 weeks including supervisor walkthroughs
Phase 3: Rollout and Continuous Refinement
RolloutLive screens on the floor and desktop access for supervisors and management
RefinementAdjust alert thresholds and views based on shift feedback in the first 60 days
OutcomeOne consistent view of the plant replacing four separate reporting habits
What Changes on the Floor After Go-Live
A 1.2 MTPA long products plant rolled out a real-time dashboard across its two rolling mills and finishing line over a six-week period, connecting the SCADA historian, CMMS, and lab system into one screen visible in the control room, the maintenance office, and on the general manager's desktop. Before the rollout, the average stoppage took 22 minutes to diagnose because the shift supervisor had to call maintenance and the lab separately to rule out causes. After go-live, the same diagnosis took under 6 minutes because the cause — an open work order, an energy spike, or a quality hold — was already visible on the shared screen. Shift handover meetings shortened from 25 minutes of verbal recap to 8 minutes of reviewing the automated log, freeing supervisor time for the floor instead of paperwork.
Before this, my first hour every morning was spent calling three people to piece together what happened overnight. Now I open one screen and I already know before the shift meeting starts. That alone has changed how fast we react to problems.
— Plant Operations Manager, Long Products Mill, 1.2 MTPA
Frequently Asked Questions
What data sources feed a real-time steel plant dashboard?
The core feeds are the SCADA or PLC network for production data, the CMMS for maintenance and work order status, plant energy meters, and the quality lab system or entry forms. You can review the exact integration list during a
demo call for your specific plant setup.
Can a real-time dashboard replace the CMMS and SCADA system?
No, it sits on top of them. The dashboard pulls and combines data from the existing CMMS and SCADA rather than replacing either, so plants keep their current systems while gaining one unified screen for daily decisions.
How long does deployment take on an existing plant?
A typical single-line deployment takes 6 to 10 weeks from source mapping to go-live, depending on how many systems need to be connected and how many role-based views are configured for supervisors and management.
Who should have access to the dashboard?
Access is usually role-based rather than open to everyone: shift supervisors see their line, maintenance managers see work orders and equipment health, and general managers see plant-wide KPIs, all drawn from the same live data.
Does this work for plants with older, non-networked equipment?
Yes, older equipment without a network connection can be added through manual entry forms or basic sensors feeding the same dashboard, and the connected lines are prioritized first. Start a
free trial to see how your current setup maps in.
One Screen. Every Shift. Every Department.
Stop Chasing Data Across Four Systems
Bring production, maintenance, energy, and quality onto one live dashboard your whole team already trusts by the second week.