Spare parts stockouts cost steel plants $50k–$120k per hour in unplanned downtime — yet most facilities still manage inventory with static reorder points set 18 months ago, oblivious to changing asset age, accelerating maintenance cycles, or production schedule shifts. Traditional inventory management creates a false choice: stock too little and risk emergency air freight costing 300% above standard pricing, or stock too much and tie up millions in slow-moving parts that age into obsolescence. AI-driven demand forecasting eliminates this trap by continuously predicting which parts will be needed — not when you already need them, but weeks in advance — based on live work order data, asset condition scores, maintenance schedules, and supplier lead times. Plants deploying OxMaint's AI spare parts forecasting report 20–30% reduction in working capital tied to MRO inventory while simultaneously improving parts availability by 15–25%.
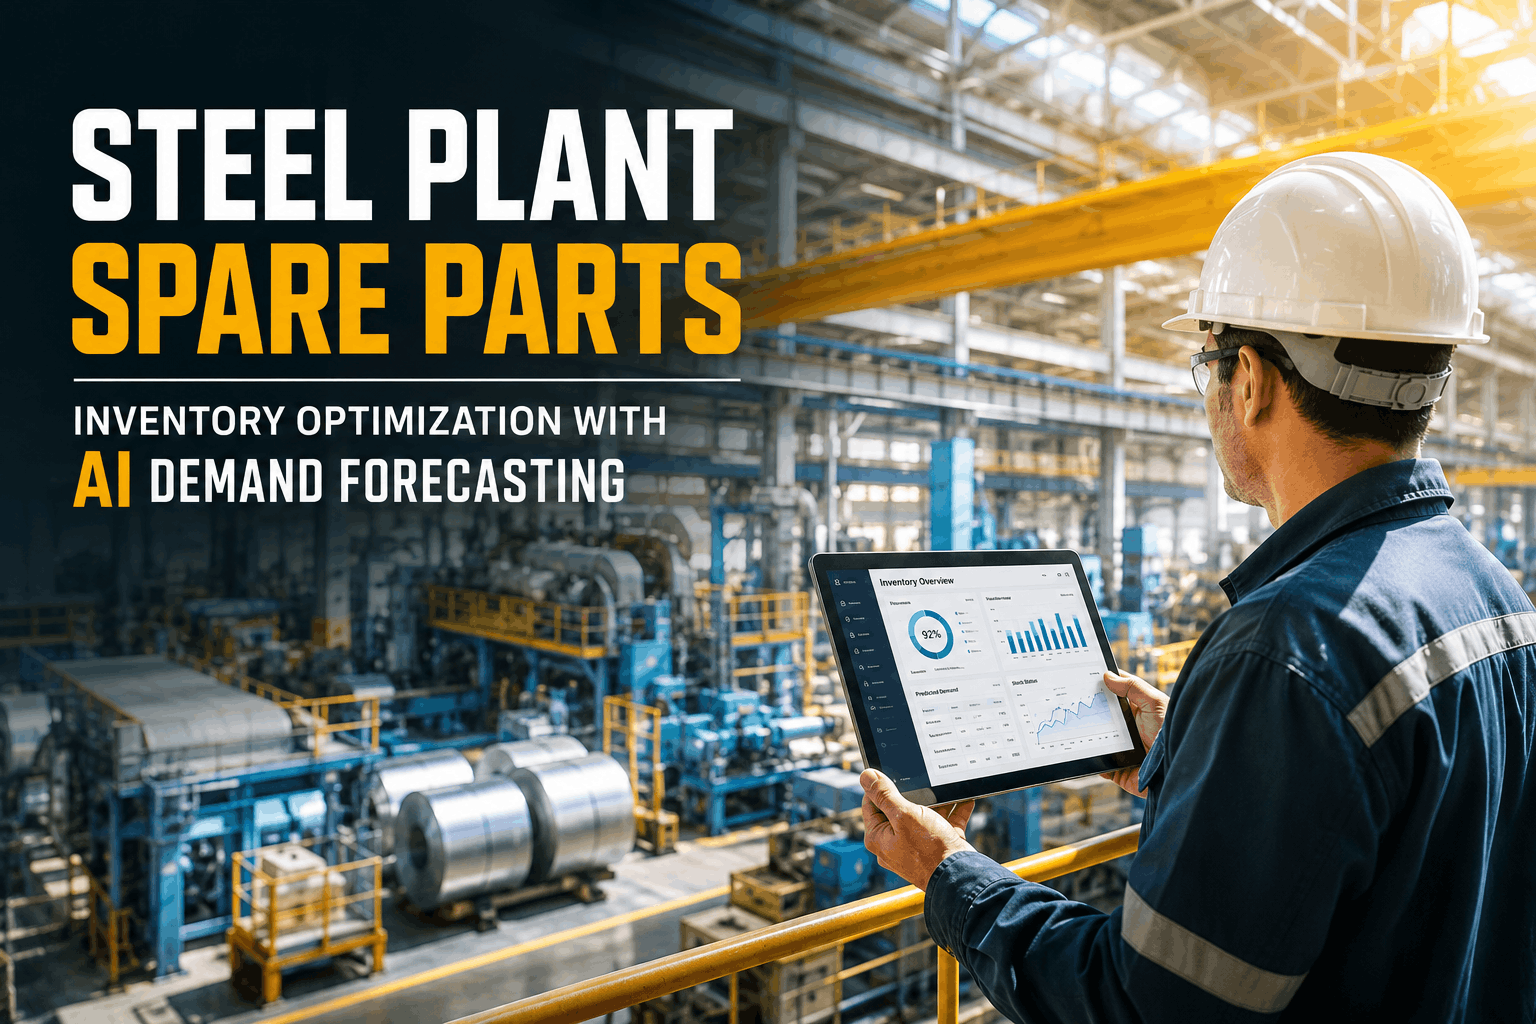
Steel Plant Spare Parts Inventory Optimization with AI Demand Forecasting
Predict parts demand weeks in advance using AI, optimize safety stock levels, prevent stockouts, reduce emergency procurement costs, and maintain critical parts availability across multi-site steel operations with predictive inventory automation.
The Four Silent Killers of Steel Plant Spare Parts Management
Spare parts inventory management in steel plants fails silently. The system says stock is available — but the bin is empty. The ERP shows a part is reordered — but the supplier quote is 12 weeks out. A critical bearing is needed today — and must be air-freighted at 3× cost. Inventory sits untouched for 5 years until the equipment is retired. These are not isolated incidents — they are systematic failures baked into static, reactive inventory approaches. The four root causes below appear in nearly every steel plant without AI-driven demand sensing. Each causes measurable cost leakage. Together, they create the chaotic MRO environment where unplanned emergencies dominate and planned inventory optimization never begins.
AI Demand Forecasting — Predicting Parts Consumption Weeks in Advance
Static reorder points are based on historical averages — but history is not a predictor of the future. An electric arc furnace (EAF) bought 8 years ago consumes electrode holders at a different rate than a new EAF running optimized charge schedules. A reheating furnace with 40,000 operating hours ages into accelerating maintenance cycles — consuming more seal parts, more refactory lining, and more drive components than the same furnace did at 2,000 hours. AI demand forecasting uses five data streams to predict parts consumption: (1) current asset condition scores from predictive analytics, (2) live maintenance schedule and PM intervals, (3) actual historical consumption velocity, (4) failure trend patterns per asset type, and (5) production schedule variations. The result is a demand forecast that updates weekly — not a static number set once per budget cycle. When forecasted demand for a critical bearing jumps from 1 unit/month to 3 units/month because underlying asset condition has degraded, OxMaint automatically flags this and recommends safety stock increase. The forecast fires purchase orders 4–8 weeks before demand actually materializes — turning reactive stockouts into planned procurement.
Criticality-Velocity Matrix — Stock Strategy Aligned With Risk, Not Guesswork
Not all parts carry the same risk or cost consequence. A bearing for a slow-speed auxiliary motor costs $800 and has a 10-week lead time — but a bearing failure stops production for 2 hours, costing $8k. A pump seal costs $120 and has a 2-week lead time — but a seal failure floods a critical cooler, halting the entire facility for 18 hours and costing $96k. Traditional inventory management stocks all parts to the same service level. The result: overstocking low-risk items while understocking high-consequence components. The criticality-velocity matrix below classifies every part in your inventory by two dimensions: impact severity (if the part fails, how much production cost is lost per hour?) and availability risk (how volatile is the supplier lead time?). Parts in the upper right quadrant — high consequence + long/volatile lead time — warrant higher safety stock and earlier reorder points. Parts in the lower left — low consequence + short lead time — can be held at minimal stock. This alignment reduces total inventory investment by 18–25% while improving fill rates for critical components by 12–20%.
Dynamic Safety Stock Calculation — Real Lead Times, Not Catalog Promises
Traditional inventory models calculate safety stock using catalog lead times. But OEM promises and actual delivery performance often diverge by 3–4 weeks. If your reorder point assumes 6-week lead time but actual performance is 9–10 weeks, you run a stockout every time demand spikes unexpectedly. OxMaint logs actual supplier delivery performance against purchase order promise dates for every SKU. Over time, this builds a distribution of real lead times per supplier per part. Safety stock is then calculated not from optimistic catalog specs, but from the actual 90th percentile lead time you experience — meaning 90% of orders deliver before you need the part, and only 10% slip past your safety buffer (acceptable risk). This dynamic approach typically increases safety stock by 2–4 weeks for chronically late suppliers, but reduces it for reliable suppliers — optimizing total inventory investment while reducing actual stockout risk by 40–50%.
Before OxMaint, we managed spare parts with spreadsheets and tribal knowledge. We'd get surprised by equipment failures and rush-order parts at 3× cost. Our working capital was tied up in parts for equipment retired five years ago. After deploying AI forecasting, our system now predicts demand four weeks out. We reduced emergency orders by 85% and cut inventory investment by $620k while improving parts availability by 18%. The AI looks at asset age, condition scores, maintenance schedules, and supplier performance — not just historical averages.
Multi-Site Inventory Pooling — One Surplus Prevents a Thousand-Mile Emergency Expedite
Multi-site steel operators manage 4–12 facilities, each maintaining independent spare parts inventories. In practice, this creates redundant safety stock at every site — a bearing ordered by Plant A is also stocked at Plants B, C, and D. If Plant A stock is full and Plant B runs low, there is no system to detect the opportunity to transfer the surplus. Result: Plant B emergency-orders the same bearing while Plant A sits on excess. The surplus-transfer visibility alone at multi-site operations prevents $200k–$600k in unnecessary emergency procurement annually. OxMaint's multi-site inventory module provides a real-time portfolio view of all spare parts holdings across all facilities simultaneously. When a part is flagged as surplus at Site A (consumption rate has fallen below stock), the system alerts materials managers at Sites B and C that a transfer is available before they place emergency orders. Transfers move inventory where it is needed, reducing total holdings while improving fill rates.
Frequently Asked Questions
Stop Guessing About Parts Demand — Let AI Predict It Weeks in Advance.
OxMaint predicts spare parts demand 4–8 weeks forward using asset condition, maintenance schedules, and supplier lead times — eliminating stockouts and reducing working capital by 20–30% while improving parts availability by 15–25%.