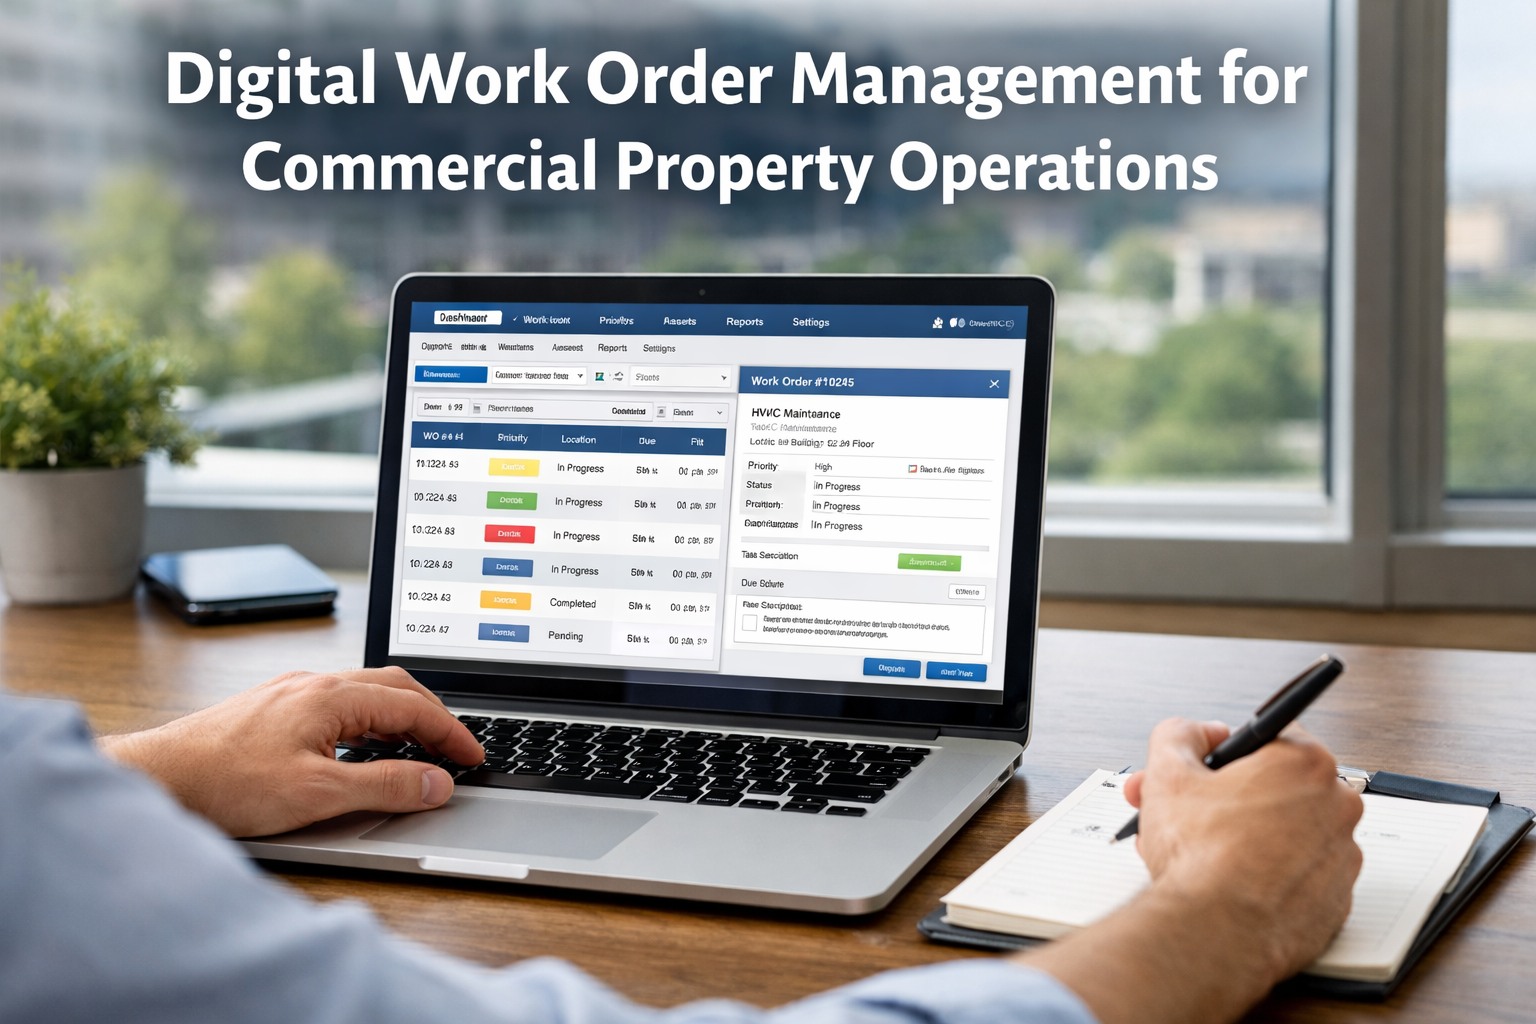
Property maintenance managers who do not track key performance indicators (KPIs) are managing by intuition — which means they cannot prove maintenance ROI, justify budget requests, or identify underperforming properties before they become financial liabilities. The 20 KPIs below represent the complete set of metrics that separate high-performing maintenance portfolios from those that operate in crisis mode. Property managers across the United States who track these 20 metrics consistently report maintenance cost reductions of 18 to 27 percent within the first 12 months — because they can finally see where waste is hiding and which assets are driving emergency spend. Start a free trial to see how Oxmaint automatically tracks every one of these KPIs across your entire portfolio.
PROPERTY MAINTENANCE · KPI DASHBOARD · PERFORMANCE METRICS · 2026 GUIDE
The 20 Most Important Property Maintenance KPIs (And How to Track Them)
Work order response time, first-time fix rate, cost per unit, PM compliance, backlog aging, technician productivity, vendor performance, MTTR, MTBF, asset health score, tenant satisfaction, and budget variance — the complete KPI dashboard for property maintenance managers.
18–27%
Maintenance cost reduction when tracking these 20 KPIs consistently
20
Essential KPIs that separate high-performing portfolios from reactive ones
4.2×
Higher budget approval rate with data-backed KPI presentations to ownership
30 min
Time to generate complete KPI dashboard in Oxmaint vs 2+ hours manually
KPIs Are Not Just Numbers — They Are the Language of Maintenance Performance
Property managers who master KPI tracking communicate maintenance value in terms CFOs and owners understand: cost per unit, budget variance, and ROI. Those who ignore KPIs communicate in anecdotes and emergencies. The 20 KPIs below are organized into six logical categories — Work Order Performance, Financial Efficiency, Preventive Maintenance, Asset Reliability, Vendor Management, and Tenant Impact. Each KPI includes a clear definition, calculation formula, industry benchmark, and tracking method. Start a free trial to see Oxmaint's automated KPI dashboard in action.
Category 1 · Work Order Performance
KPIs 1–4: Response Time, Completion Time, First-Time Fix Rate, and Backlog
Work order performance metrics tell you how quickly and effectively your team responds to maintenance requests. These are the most visible KPIs to tenants and the most directly tied to satisfaction scores. Properties that track and publish these four metrics see tenant maintenance complaint rates drop by 40 to 60 percent within six months.
KPI 1
Work Order Response Time
Definition: Time from work order creation to technician acknowledgment.
Calculation: Sum of (acknowledge time − create time) ÷ number of work orders.
Target: Emergency <15 min, Urgent <4 hours, Routine <48 hours.
Book a demo to see automated response time tracking.
KPI 2
Work Order Completion Time
Definition: Time from work order creation to completion (including parts/labor). Calculation: Sum of (complete time − create time) ÷ number of completed work orders. Target: Emergency <2 hours, Urgent <24 hours, Routine <7 days.
KPI 3
First-Time Fix Rate (FTFR)
Definition: Percentage of work orders resolved in a single visit. Calculation: (Work orders requiring one visit ÷ Total completed work orders) × 100. Target: ≥75% for guest room requests, ≥85% for common area.
KPI 4
Work Order Backlog
Definition: Number of open work orders at any given time. Calculation: Count of work orders with status ≠ closed. Target: <10% of monthly volume. Backlog >20% indicates understaffing or process failure.
Category 2 · Financial Efficiency
KPIs 5–8: Cost Per Unit, Cost Per Square Foot, Budget Variance, and Overtime Percentage
Financial KPIs are the metrics CFOs and owners care about most. These numbers appear in monthly owner reports, annual budget presentations, and refinancing due diligence. Properties that cannot produce these four metrics struggle to justify headcount increases, capital requests, or rent increases tied to maintenance quality.
KPI 5
Maintenance Cost Per Unit
Definition: Total maintenance spend divided by number of units. Calculation: (Labor + parts + contracts + materials) ÷ total units. Target: $800–1,500/year per unit depending on property class.
KPI 6
Maintenance Cost Per Square Foot
Definition: Total maintenance spend divided by square footage. Calculation: Total maintenance operating spend ÷ total square feet. Target: $1.20–2.50/sq ft depending on property age and service level.
KPI 7
Budget Variance (%)
Definition: Actual maintenance spend vs budgeted amount. Calculation: ((Actual − Budget) ÷ Budget) × 100. Target: Within ±5% monthly, within ±3% annually. Variance >10% requires investigation.
KPI 8
Overtime Percentage
Definition: Overtime hours as percentage of total paid hours. Calculation: (Overtime hours ÷ Total paid hours) × 100. Target: <5% for planned operations. >10% indicates understaffing or poor scheduling.
Category 3 · Preventive Maintenance
KPIs 9–12: PM Compliance, PM Aging, PM vs Corrective Ratio, and Scheduled vs Emergency Ratio
Preventive maintenance KPIs measure how effectively your team is avoiding failures before they happen. These are leading indicators — good PM metrics today predict low emergency repair costs six months from now. Portfolios with PM compliance above 85% spend 35–50% less on emergency repairs than those below 60%.
KPI 9
PM Compliance (%)
Definition: Percentage of scheduled PM tasks completed on time. Calculation: (PM work orders completed on schedule ÷ Total PM work orders due) × 100. Target: ≥85%. Below 70% indicates systemic PM failure.
KPI 10
PM Aging (>30 days overdue)
Definition: Percentage of PM tasks overdue by more than 30 days. Calculation: (PM work orders overdue >30 days ÷ Total PM work orders) × 100. Target: <5%. PM aging over 10% predicts equipment failures within 12 months.
KPI 11
PM vs Corrective Ratio
Definition: Labor hours spent on PM vs corrective repairs. Calculation: (Total PM labor hours ÷ Total maintenance labor hours) × 100. Target: 60–70% PM, 30–40% corrective. Below 50% PM indicates reactive culture.
KPI 12
Scheduled vs Emergency Ratio
Definition: Cost of scheduled repairs vs emergency repairs. Calculation: (Emergency repair cost ÷ Total repair cost) × 100. Target: Emergency repairs <20% of total spend. Emergency repairs cost 2–4× more than scheduled.
Category 4 · Asset Reliability
KPIs 13–16: MTTR, MTBF, Asset Uptime, and Asset Health Score
Asset reliability metrics measure equipment performance and predict future failures. These are the KPIs that support capital planning and replacement budgeting. Properties that track these four metrics consistently replace assets at optimal times — not too early (wasting remaining life) and not too late (paying emergency repair costs).
KPI 13
Mean Time To Repair (MTTR)
Definition: Average time to repair an asset after failure. Calculation: Total repair hours ÷ number of repairs. Target: Varies by asset. Increasing MTTR indicates parts availability or technician skill issues.
KPI 14
Mean Time Between Failures (MTBF)
Definition: Average operating time between asset failures. Calculation: Total operating hours ÷ number of failures. Target: Increasing is good. Declining MTBF over 12 months = accelerated deterioration requiring capital intervention.
KPI 15
Asset Uptime (%)
Definition: Percentage of time asset is operational. Calculation: (Total time − Downtime) ÷ Total time × 100. Target: ≥95% for critical assets (elevators, boilers, HVAC). Below 90% triggers replacement evaluation.
KPI 16
Asset Health Score (0–100)
Definition: Weighted score based on age, repair frequency, and condition. Calculation: Age (30%) + Repair frequency (40%) + Parts availability (15%) + Energy efficiency (15%). Target: >80 for critical assets. Any asset <60 requires replacement planning.
Category 5 · Vendor Management
KPIs 17–18: Vendor Response Time and Vendor First-Time Fix Rate
Third-party vendors perform 30–60% of maintenance work in most property portfolios. Vendor performance metrics ensure you are getting what you pay for. Portfolios that track vendor KPIs reduce contractor costs by 15–25% within 12 months — by identifying underperforming vendors and negotiating better terms with high performers.
KPI 17
Vendor Response Time
Definition: Time from vendor dispatch to vendor arrival. Calculation: Sum of (arrival time − dispatch time) ÷ number of vendor calls. Target: Emergency <2 hours, Urgent <24 hours, Routine <72 hours.
KPI 18
Vendor First-Time Fix Rate
Definition: Percentage of vendor visits that resolve the issue in one trip. Calculation: (Vendor visits requiring one trip ÷ Total vendor visits) × 100. Target: ≥80%. Below 70% = vendor competency issue or parts availability problem.
Category 6 · Tenant Impact
KPIs 19–20: Tenant Satisfaction Score and Maintenance Request Volume
Tenant-facing metrics measure the resident experience of maintenance quality. These KPIs appear in lease renewal analyses and online reputation management. Properties that track these metrics and respond to negative trends see 15–25% higher lease renewal rates.
KPI 19
Tenant Satisfaction Score (Maintenance)
Definition: Average rating of maintenance responsiveness from surveys.
Calculation: Sum of survey ratings ÷ number of responses.
Target: ≥4.5/5.0. Below 4.0 correlates with reduced lease renewal rates.
Start free trial to automatically correlate satisfaction scores with response times.
KPI 20
Maintenance Request Volume per Unit
Definition: Number of maintenance requests per unit per month. Calculation: Total work orders ÷ total units ÷ months. Target: 0.3–0.8 requests per unit per month. Spikes indicate deferred maintenance surfacing or seasonal equipment issues.
KPI Dashboard in Action
How Property Managers Across the USA Use Oxmaint to Track All 20 KPIs Automatically
Property managers who implement Oxmaint's automated KPI dashboard report measurable improvements within the first 90 days — because they can finally see what was invisible before. The dashboard updates in real time, benchmarks against industry standards, and exports to owner-ready reports in under 60 seconds. Start a free trial to connect your maintenance data to a live KPI dashboard today.
| KPI Category |
Before Oxmaint (Manual Tracking) |
After Oxmaint (Automated) |
Improvement |
| Work Order Response Time |
42 min average (P1/P2) |
18 min average (P1/P2) |
−57% |
| PM Compliance Rate |
52% (estimated) |
87% (measured) |
+35% |
| Cost Per Unit (Annual) |
$1,850 |
$1,420 |
−23% |
| Emergency Repair Ratio |
34% of total spend |
18% of total spend |
−47% |
| Report Generation Time |
2.5 hours monthly |
12 minutes monthly |
−92% |
"We were tracking six KPIs manually in spreadsheets — response time, completion time, and cost per unit. It took two hours every week just to update the numbers. When we switched to Oxmaint, we suddenly had all 20 KPIs in a live dashboard. The biggest surprise was our PM compliance — we thought we were at 80%, but Oxmaint showed we were actually at 54%. That gap explained why our emergency repairs were so high. Within six months of focused PM improvement, our emergency repair spend dropped 31%."
— Regional Property Manager, Multi-Family Portfolio, Phoenix, Arizona (Managing 6 Properties, 850 Units)
Questions
Frequently Asked Questions About Property Maintenance KPIs
Which KPIs should I start tracking first if I track nothing today?+
Start with four: Work Order Response Time (KPI 1), PM Compliance (KPI 9), Cost Per Unit (KPI 5), and Tenant Satisfaction Score (KPI 19). These four give you visibility into speed, prevention, cost, and quality — the four dimensions that matter most to owners and tenants. Once these are stable, add the remaining 16 KPIs over 3–6 months.
How do I benchmark my KPIs against industry standards?+
Industry benchmarks vary by property class (luxury, mid-tier, affordable), age, and geographic region. Oxmaint's benchmarking module compares your KPIs against anonymized peer data from 2,000+ properties across the USA — you see exactly where you stand relative to similar properties.
Book a demo to see benchmarking in action.
How often should KPIs be reviewed by property managers?+
Daily: Response time, emergency work order volume, PM tasks due today. Weekly: PM compliance percentage, technician utilization, backlog aging. Monthly: All 20 core KPIs presented to ownership and regional management. Quarterly: Asset health scores, MTBF trends, capital reserve adequacy. The dashboard should be live — no manual data gathering.
What is a realistic first-time fix rate target for a multi-family portfolio?+
For guest room/unit requests: 70–75% is realistic for most portfolios. Above 80% is excellent. For common area maintenance: 85–90% is achievable because common areas have more predictable issues. If your FTFR is below 60%, investigate parts availability (technicians don't have what they need), training (technicians lack skills), or work order clarity (descriptions insufficient).
How does a CMMS automate KPI tracking?+
A CMMS like Oxmaint automatically captures timestamped data at every step: work order creation time, technician acknowledgment, completion time, parts used, labor hours, and completion photos. These data points feed directly into KPI calculations — no manual entry, no spreadsheet manipulation, no data lags. The dashboard updates in real time as technicians complete work.
What is a healthy work order backlog percentage?+
Backlog should be less than 10% of monthly work order volume. Example: if you average 200 work orders per month, backlog should be under 20 open work orders at any time. Backlog above 20% indicates understaffing, inefficient processes, or poor prioritization. Track backlog aging separately — work orders open >30 days are a separate problem requiring management attention.
Can I export KPI dashboards for owner presentations?+
Yes. Oxmaint exports KPI dashboards to PDF, Excel, and PowerPoint formats — with charts, trend lines, and year-over-year comparisons. The export includes a one-page executive summary with red/amber/green status indicators for each KPI, plus drill-down detail by property for owners who want specifics.
Start free trial to generate your first owner-ready KPI report.
Track All 20 KPIs Automatically — Without Touching a Spreadsheet
Oxmaint's automated KPI dashboard pulls data from every work order, every PM task, and every vendor interaction — presenting your complete maintenance performance in real time. Stop guessing. Start measuring.
.png)


.png)