A food processing plant reduced their operating costs by $1.8 million annually without cutting production capacity or workforce. Their transformation started with detailed cost tracking that revealed compressed air leaks were consuming $220,000 per year in wasted electricity, predictive maintenance reduced emergency repair costs by 68%, and optimizing batch sizes cut raw material waste by 22%. Manufacturing cost reduction requires systematic analysis of where money actually disappears in your operation, not across-the-board budget cuts that damage production capability. Plants that implement structured cost optimization programs combining energy efficiency, maintenance excellence, process improvement, and waste elimination typically achieve 15-30% total operating cost reduction within 18 months. The difference between profitable manufacturing and struggling to compete often comes down to hundreds of small inefficiencies that individually seem insignificant but collectively destroy margins. Book a cost assessment to identify your highest-impact reduction opportunities.
Why Cost Reduction Programs Fail
Most manufacturing cost reduction initiatives focus on easy targets like cutting training budgets, deferring equipment upgrades, or pressuring suppliers for price concessions. These approaches provide short-term expense relief but often increase total cost of operation through quality problems, equipment failures, and supplier relationship damage.
Sustainable cost reduction requires identifying and eliminating waste in your processes, not starving your operation of necessary resources. A bearing that fails because you skipped $40 in preventive lubrication creates $15,000 in emergency repair costs and $80,000 in lost production. Cutting the wrong costs amplifies total operating expenses.
78%
of manufacturing operating costs are fixed or semi-variable, driven by your processes and equipment efficiency rather than headcount or raw material pricing. This means the highest-impact cost reduction comes from process optimization and waste elimination, not workforce reductions or supplier negotiations.
Effective programs combine technology investments that reduce consumption, process changes that eliminate waste, and data systems that make cost drivers visible to the people who can act on them. When operators can see that their machine consumes $180 per hour in electricity, they become motivated to eliminate unnecessary runtime.
Energy Efficiency & Utility Cost Reduction
Energy typically represents 15-25% of manufacturing operating costs. Small efficiency improvements compound across thousands of operating hours to create substantial savings.
Compressed air is the most expensive utility in manufacturing, often costing $0.25-$0.50 per 1,000 cubic feet. A single 1/4-inch air leak wastes $2,500 annually in electricity.
Implementation Actions:
Conduct quarterly ultrasonic leak detection surveys
Install pressure regulators at point-of-use to reduce system pressure
Implement compressor sequencing to eliminate unloaded runtime
Replace compressed air uses with electric alternatives where feasible
Typical Savings: 20-35% of compressed air energy costs
LED lighting reduces energy consumption by 50-75% compared to metal halide or fluorescent fixtures while providing superior light quality and requiring minimal maintenance.
Implementation Actions:
Replace high-bay fixtures with LED equivalents
Install occupancy sensors in warehouses and offices
Implement daylight harvesting in areas with natural light
Negotiate utility rebates for qualifying upgrades
Typical Savings: $0.50-$1.50 per square foot annually
Motors running at fixed speed waste enormous energy when full output is not needed. VFDs reduce energy consumption by matching motor speed to actual load requirements.
Implementation Actions:
Install VFDs on HVAC fan motors, cooling tower fans, and pumps
Retrofit process equipment with variable loads
Implement automated speed control based on demand
Monitor energy savings with sub-metering
Typical Savings: 15-40% energy reduction per motor
Peak demand charges can represent 30-50% of industrial electric bills. Managing when equipment runs eliminates expensive demand spikes and qualifies for utility incentive programs.
Implementation Actions:
Stagger startup of large motors to avoid demand peaks
Schedule batch processes during off-peak hours
Enroll in utility demand response programs for rebates
Install energy storage for peak shaving applications
Typical Savings: 10-25% reduction in total electric costs
Thermal processes consume massive energy. Improving insulation, recovering waste heat, and optimizing temperature setpoints reduce fuel and electricity costs significantly.
Implementation Actions:
Install heat recovery systems on ovens, dryers, and furnaces
Upgrade insulation on vessels, pipes, and ductwork
Optimize boiler combustion efficiency through tuning
Implement automated temperature controls to eliminate overheating
Typical Savings: 15-30% of process heating energy
Track Energy Consumption By Equipment & Shift
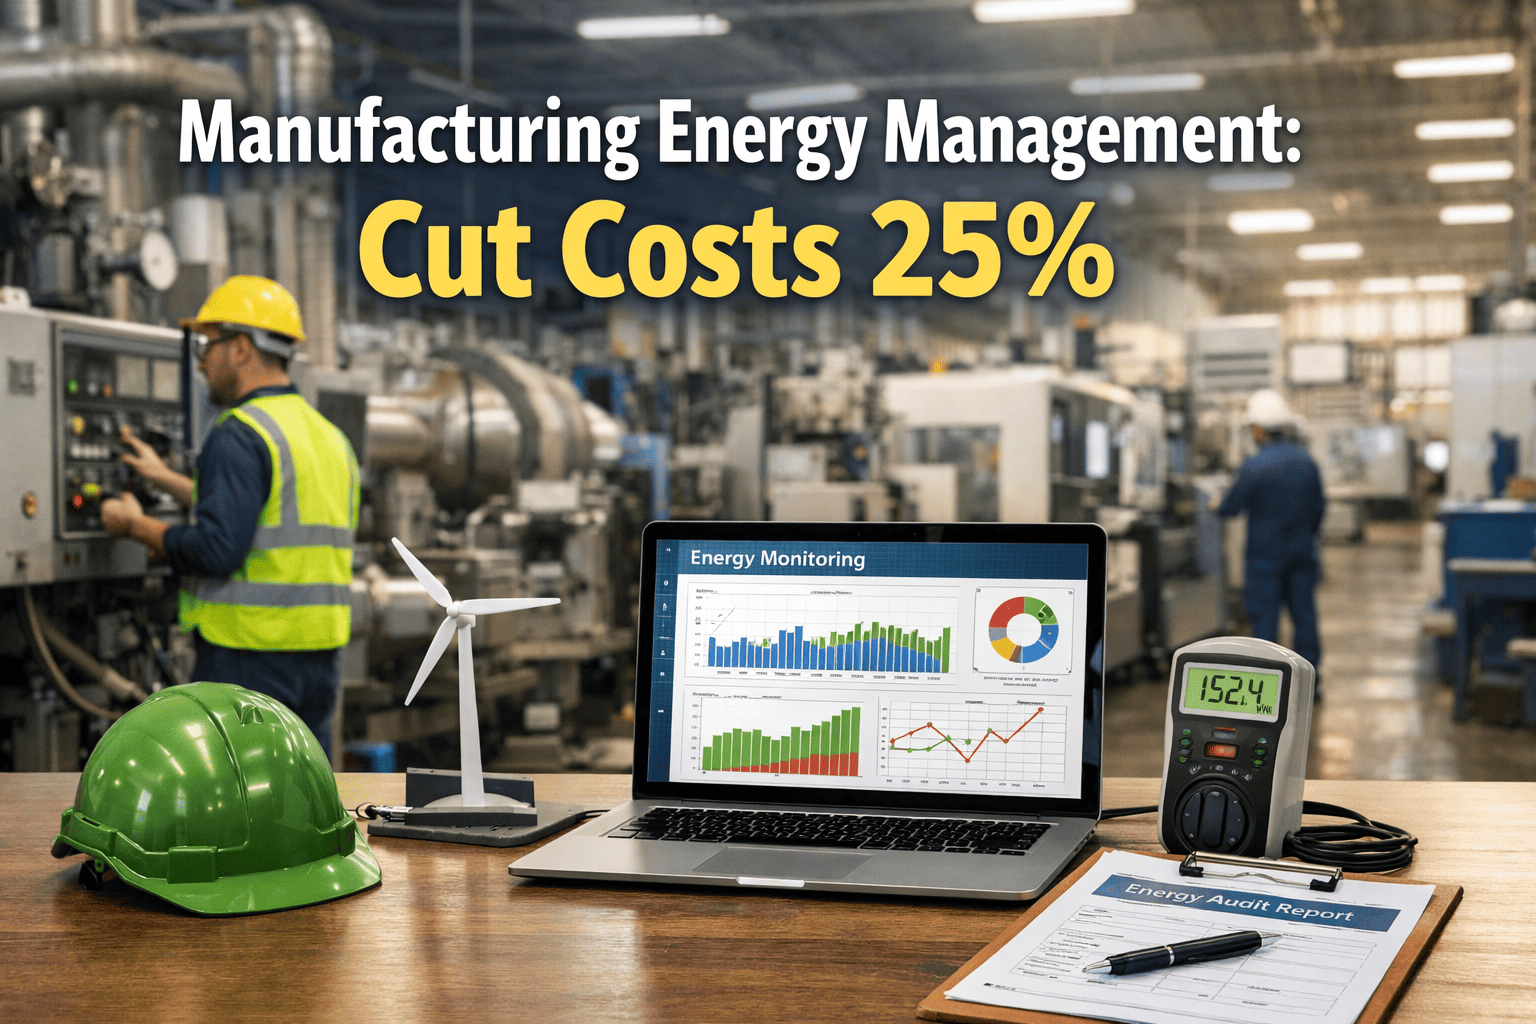
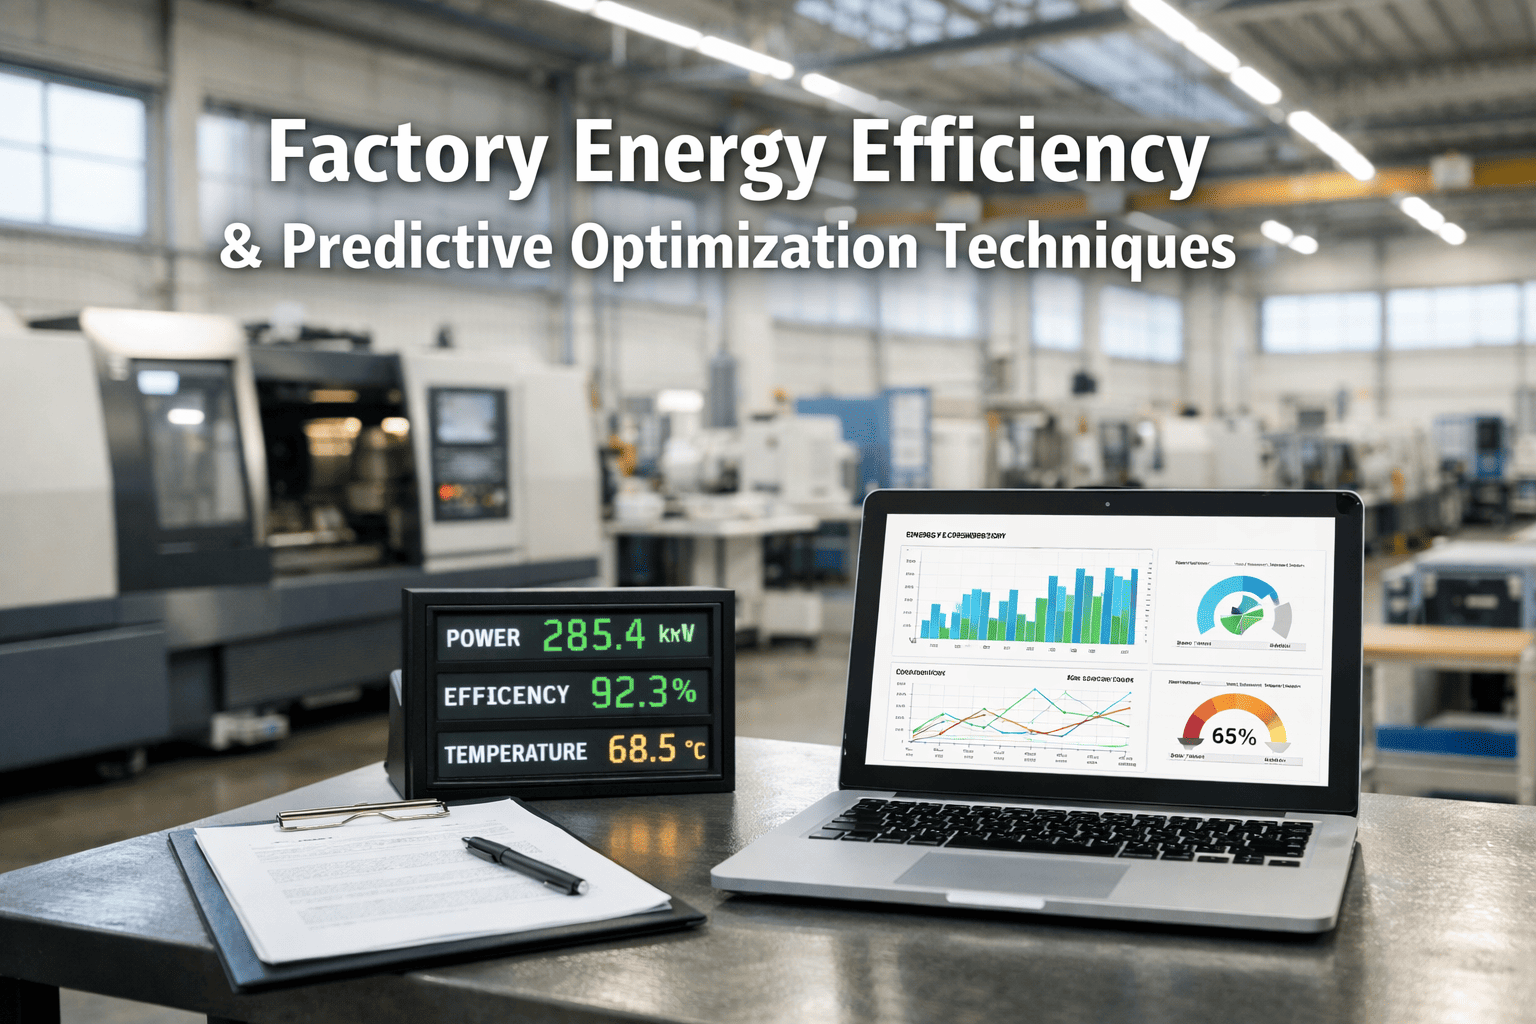
Oxmaint energy monitoring dashboards show exactly which machines, production lines, and time periods consume the most utilities, allowing you to target efficiency improvements where they deliver maximum savings with real-time cost visibility.
Maintenance Optimization & Reliability Improvement
Maintenance costs directly impact operating expenses through parts spending, labor hours, and production downtime. Shifting from reactive to predictive maintenance cuts total costs by 25-40%.
Condition monitoring technologies detect equipment degradation weeks before failure, allowing planned repairs during scheduled downtime instead of catastrophic emergency breakdowns.
Implementation Actions:
Deploy vibration analysis on critical rotating equipment
Implement thermal imaging for electrical systems
Establish oil analysis programs for gearboxes and hydraulics
Train technicians on ultrasonic leak detection
Typical Savings: $100K-$500K annually for mid-size plants
Most plants carry 30-50% excess spare parts inventory while simultaneously experiencing stockouts on critical items. Data-driven stocking strategies reduce capital tied up in parts.
Implementation Actions:
Conduct ABC analysis ranking parts by criticality and value
Eliminate obsolete parts from discontinued equipment
Establish vendor-managed inventory for high-volume consumables
Standardize components across equipment when possible
Typical Savings: 20-35% reduction in inventory carrying costs
Unplanned reactive work costs 3-5 times more than equivalent planned maintenance. Scheduling preventive work during production gaps maximizes technician productivity and equipment uptime.
Implementation Actions:
Create weekly maintenance schedules coordinated with production
Stage parts and tools before scheduled outages
Develop detailed job plans for repetitive maintenance tasks
Track wrench time percentage to improve labor efficiency
Typical Savings: 25-40% improvement in maintenance productivity
RCM methodology identifies the optimal maintenance strategy for each asset based on criticality and failure mode, eliminating unnecessary preventive tasks while intensifying monitoring on critical equipment.
Implementation Actions:
Classify equipment by production impact and safety risk
Eliminate low-value PM tasks on non-critical assets
Implement condition-based intervals instead of calendar-based
Document failure modes and root cause corrective actions
Typical Savings: 15-30% reduction in total maintenance costs
Service contracts and contractor labor often escape scrutiny despite representing 20-40% of maintenance spending. Competitive bidding and scope verification reduce these costs substantially.
Implementation Actions:
Re-bid service contracts every 2-3 years
Negotiate blanket purchase orders with preferred vendors
Bring routine work in-house to reduce contractor dependency
Audit contractor invoices for accuracy and scope creep
Typical Savings: 15-25% reduction in contractor spending
Production Efficiency & Waste Elimination
Process inefficiency wastes raw materials, consumes excess labor hours, and generates scrap that must be disposed of at additional cost. Lean manufacturing principles eliminate these hidden drains on profitability.
Every percentage point improvement in first-pass yield flows directly to bottom-line profit. Root cause analysis of defects and process variation reduces material waste and rework labor.
Implementation Actions:
Implement statistical process control on critical dimensions
Conduct Pareto analysis ranking defect types by frequency
Optimize process parameters through design of experiments
Train operators on quality at the source principles
Typical Savings: 2-5% yield improvement worth $200K-$1M annually
Faster changeovers between product runs increase effective capacity without capital investment while reducing the economic batch size to lower inventory carrying costs.
Implementation Actions:
Convert internal setup activities to external where possible
Standardize tooling and fixtures across product families
Create changeover carts with pre-staged components
Document and train on optimized changeover sequences
Typical Savings: 40-70% reduction in changeover duration
OEE measures the percentage of scheduled time equipment produces quality parts at designed speed. Improving OEE from 65% to 80% equals 23% more output from existing assets.
Implementation Actions:
Track downtime by reason code to identify improvement priorities
Eliminate micro-stops through better material flow design
Address chronic speed losses with process optimization
Implement autonomous maintenance to reduce breakdowns
Typical Savings: 10-20 point OEE improvement equals $300K-$1.5M value
Flexible workforce capable of operating multiple processes reduces overtime requirements and allows dynamic reallocation based on production demand without adding headcount.
Implementation Actions:
Create skills matrix tracking operator certifications
Implement structured on-the-job training programs
Eliminate non-value-added motion through workstation redesign
Standardize work methods to reduce variation in task duration
Typical Savings: 15-25% improvement in labor productivity
Strategic sourcing, volume consolidation, and payment term negotiation reduce purchased material costs while improving supply reliability and reducing expedite fees.
Implementation Actions:
Consolidate spend with fewer strategic suppliers for volume discounts
Negotiate consignment inventory for high-volume materials
Implement blanket purchase orders to reduce transaction costs
Optimize order quantities based on total cost of ownership
Typical Savings: 5-12% reduction in purchased material costs
Measure, Monitor, and Optimize Every Cost Driver
Oxmaint connects energy consumption, maintenance spending, production efficiency, and quality metrics into unified dashboards that reveal exactly where your money goes and which improvement projects deliver the highest ROI with automated cost tracking and savings verification.
Implementation Priority Matrix
Not all cost reduction strategies deliver equal value or require similar effort. This matrix helps you prioritize initiatives based on implementation difficulty versus potential savings impact.
Quick Wins - Start Here
High Impact, Low Effort
Compressed air leak surveys and repair
LED lighting retrofits with utility rebates
Spare parts inventory rationalization
Service contract competitive re-bidding
Demand response program enrollment
Major Projects
High Impact, High Effort
Predictive maintenance program buildout
VFD installation on major motor loads
OEE improvement through TPM implementation
Process optimization for yield improvement
Heat recovery system installation
Fill-In Work
Low Impact, Low Effort
Office area occupancy sensor installation
Vendor payment term renegotiation
Small equipment insulation upgrades
Operator cross-training documentation
Maintenance planning checklist refinement
Reconsider or Defer
Low Impact, High Effort
Full ERP system replacement projects
Extensive facility expansion for efficiency
Unproven experimental technologies
Minor process tweaks with unclear ROI
Organizational restructuring for cost reduction
Cost Reduction Strategy Questions
What is the fastest way to reduce manufacturing costs?
Start with compressed air leak detection and repair combined with LED lighting upgrades. These projects deliver 12-24 month payback with minimal disruption.
Track energy savings to validate results and build momentum for larger initiatives.
How much can predictive maintenance really save?
Typical plants reduce total maintenance costs by 25-40% through predictive technologies that catch failures early. Emergency repair costs drop 60-80% when you fix problems during scheduled downtime instead of catastrophic breakdowns that damage secondary equipment.
Should we cut workforce to reduce operating costs?
Workforce reduction should be the last resort after exhausting process improvement opportunities. Automation and efficiency gains naturally reduce labor needs over time through attrition without the morale damage and institutional knowledge loss of layoffs.
How do we prioritize which cost reduction projects to tackle first?
Focus on quick-win projects with payback under 18 months that require minimal capital. Use savings from early projects to fund larger initiatives.
Get expert guidance on building a phased implementation roadmap tailored to your operation.
What role does employee engagement play in cost reduction?
Frontline workers who operate equipment daily see waste and inefficiency management misses. Structured suggestion programs with financial incentives for implemented ideas generate 30-50% of total cost reduction opportunities while improving morale and retention.
How do we sustain cost reduction gains long-term?
Implement continuous monitoring dashboards that make costs visible daily. When operators and supervisors see real-time energy consumption and efficiency metrics, they maintain improvements rather than allowing gradual performance decay back to previous waste levels.
Turn Cost Reduction From Project to Permanent Practice
Oxmaint transforms one-time cost cuts into sustainable operational excellence through continuous monitoring, automated alerts when efficiency degrades, and data-driven prioritization of improvement opportunities that deliver measurable bottom-line impact month after month.