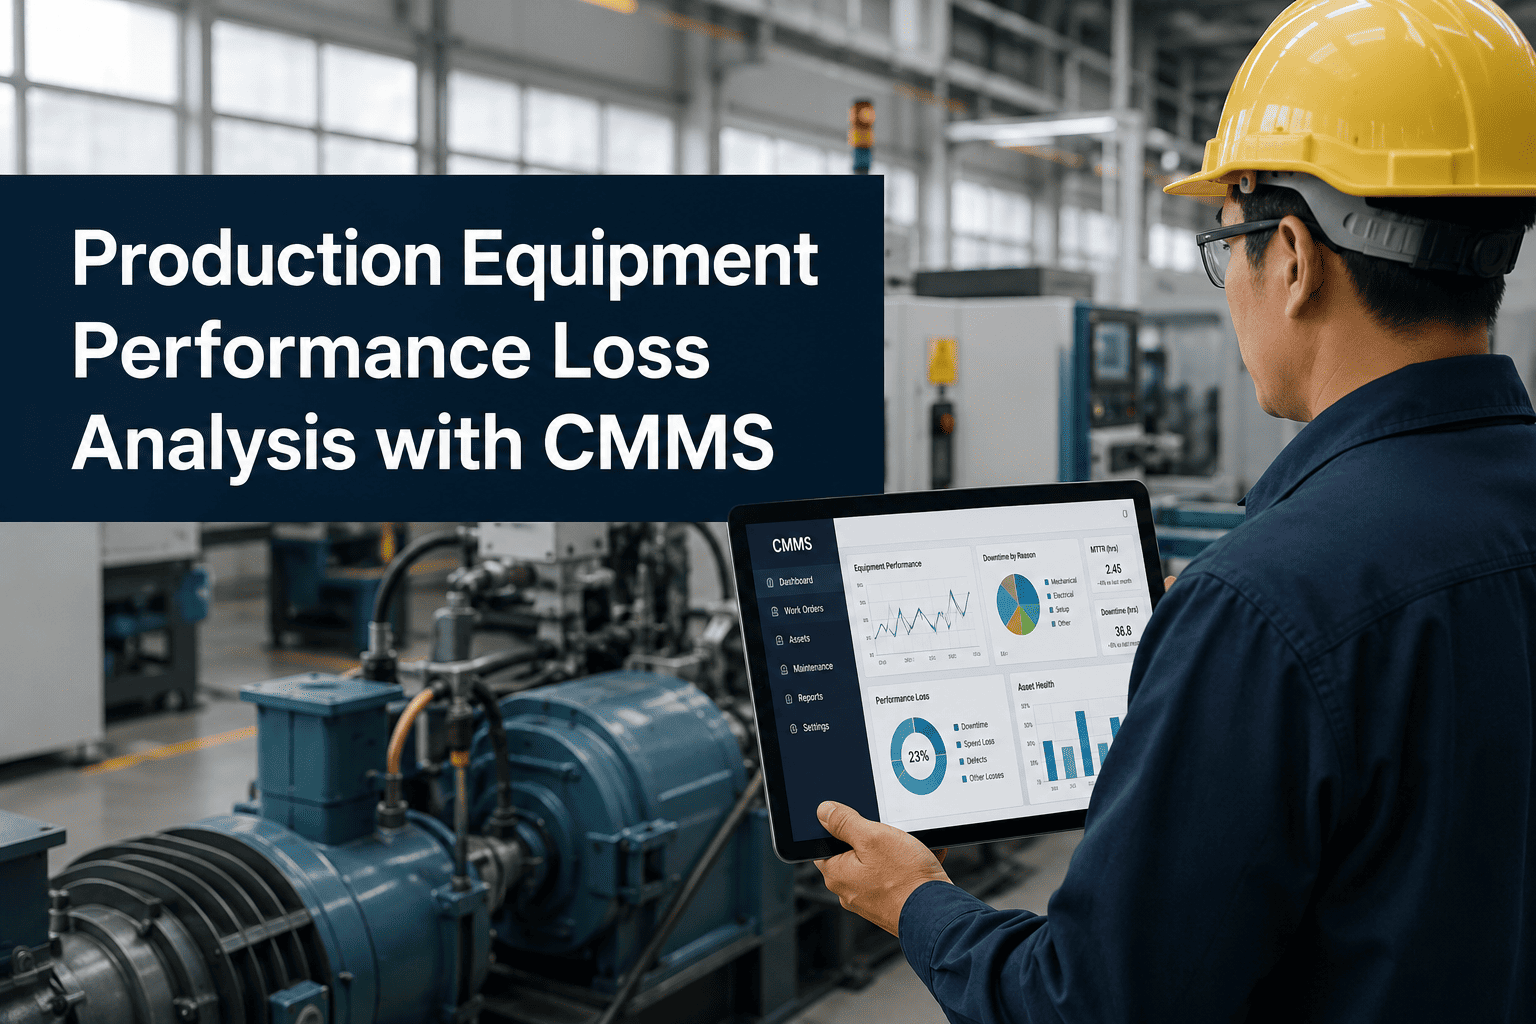
Most production floors have throughput barriers hiding in plain sight — unplanned downtime on a single asset, backlogged work orders on a shared resource, or inspection gaps that let slow degradation accumulate across the line. Identifying and prioritizing those constraints requires structured maintenance data, not anecdote. Sign Up Free to see how OxMaint gives production and maintenance teams the asset records, work order history, and condition-based PM data needed to locate throughput barriers before they become scheduled losses the business has stopped questioning.
Reveal the Constraints Your Production Floor Has Stopped Seeing
OxMaint connects asset condition records, PM completion history, and work order data to help teams surface bottlenecks, prioritize improvement work, and unlock durable throughput gains across the plant.
Why Production Constraint Discovery Starts with Maintenance Data
Throughput barriers on the plant floor are rarely visible to production scheduling systems — they surface in maintenance records, inspection findings, and work order backlogs months before they show up as lost output. Facilities that Book a Demo with OxMaint learn how asset condition history, PM completion rates, and corrective work order frequency identify the line segments where equipment degradation is silently limiting output. A constraint discovery framework built on maintenance data gives improvement teams the evidence to prioritize interventions by operational impact rather than perceived urgency.
OxMaint work order history identifies which assets generate the highest corrective maintenance frequency — surfacing the chronic breakdown contributors that constrain throughput most consistently.
Missed or overdue PM tasks accumulate into degradation that reduces asset throughput capacity. OxMaint tracks PM compliance by asset and line segment, revealing where deferred maintenance is creating the next constraint.
Condition inspection findings in OxMaint document degradation before failure — mapping which assets are trending toward a throughput-limiting event and allowing intervention before the constraint materializes.
A growing corrective backlog on a specific line segment is a leading indicator of a throughput barrier in formation. OxMaint surfaces backlog distribution across assets to focus attention before the queue becomes a production problem.
Long MTTR on specific assets reveals either chronic parts availability issues or skill gaps that compound downtime duration. OxMaint tracks repair time per asset to identify where response efficiency is limiting recovery from constraints.
OxMaint's multi-asset reporting compares downtime frequency, PM compliance, and corrective work order volume across all line assets simultaneously — locating the constraint tier in the production flow.
Production Constraint Discovery: Key Maintenance Indicators for Industrial Teams
When a disproportionate share of corrective work orders cluster on a small number of assets or line segments, those assets are generating the majority of unplanned downtime events constraining throughput. A Pareto distribution where 20% of assets generate 80% of corrective work orders identifies the maintenance constraint tier directly — no production data required. OxMaint's work order reporting surfaces this distribution across the asset register, enabling maintenance and production teams to prioritize the same equipment for improvement. Facilities that Sign Up Free can run this analysis on existing work order history immediately.
OEE measures the combined impact of availability, performance, and quality losses on production output. Assets with OEE below 65% are typically the active throughput constraint — and availability losses driven by unplanned downtime are the maintenance-controllable component. Mapping OEE by asset against OxMaint's corrective work order frequency identifies which assets are simultaneously low-OEE and high-maintenance-burden, making the constraint-maintenance link explicit. Teams that Book a Demo can see how OxMaint maintenance records support OEE analysis without requiring a separate measurement system.
Deferred preventive maintenance is the most predictable pathway to a future production constraint — and it is almost always visible in CMMS records weeks before the failure occurs. Assets with three or more overdue PM tasks are statistically more likely to generate an unplanned downtime event in the next 30 days than assets with current PM compliance. OxMaint tracks PM completion rates by asset and flags overdue tasks in the planning queue — giving constraint discovery teams a forward-looking view of where the next throughput barrier is forming.
A production constraint is not just about failure frequency — it is also about how long the line stays down after a failure. Assets where MTTR consistently exceeds four hours often reflect parts unavailability rather than repair complexity. Tracking which assets generate the longest repair durations in OxMaint identifies where parts strategy is amplifying the throughput impact of each failure event. Facilities can Sign Up Free and begin analyzing MTTR by asset against parts consumption history in OxMaint today.
Condition inspection findings classify asset health at a point in time — and when severity-rated findings accumulate on specific assets without corrective action closure, the asset is degrading toward a constraint event. Mapping open high-severity inspection findings against production criticality identifies assets where condition-based risk is highest and improvement intervention will have the largest throughput impact. OxMaint tracks inspection finding status and severity against each asset record, enabling this constraint mapping without a separate reliability database.
In multi-line facilities, shared maintenance resources — technicians, cranes, calibration equipment — create planning constraints that are invisible in individual asset records but visible in work order scheduling data. When multiple high-priority corrective work orders for different assets require the same resource simultaneously, the resource becomes the constraint rather than the asset. OxMaint's work order scheduling view surfaces resource contention across the maintenance plan, enabling constraint discovery teams to distinguish asset-driven from resource-driven throughput limitations. Teams that Book a Demo can see how OxMaint models resource scheduling against work order demand.
Production Constraint Indicators: Maintenance Data Reference
| Constraint Indicator | Data Source | Threshold Signal | OxMaint Record | Improvement Action |
|---|---|---|---|---|
| Corrective WO Frequency | Work order history | Top 20% of assets | WO frequency by asset | Root cause analysis priority |
| OEE Availability Loss | WO downtime duration | OEE below 65% | Downtime tracking | PM and reliability review |
| Deferred PM Backlog | PM schedule vs completion | 3+ overdue per asset | PM compliance rate | PM catch-up prioritization |
| MTTR by Asset | Work order timestamps | Over 4 hours average | Repair duration log | Parts stocking review |
| Open Inspection Findings | Inspection records | Multiple high-severity open | Finding status per asset | Corrective action closure |
How OxMaint Supports Production Constraint Discovery
Constraint discovery without structured maintenance data is guesswork. OxMaint connects asset condition records, PM schedules, inspection findings, and corrective work order history in a single platform — giving production and reliability teams the evidence base to locate throughput barriers by asset, line segment, or facility. When OxMaint surfaces a Pareto of corrective work order concentration or flags deferred PM accumulation on a critical asset, the improvement team has a data-driven starting point for investigation rather than a floor walk impression. Facilities can Sign Up Free and apply constraint discovery analysis to existing asset records immediately.
Implementing a Production Constraint Discovery Framework: Steps
Map Assets to Production Flow
Register all line assets in OxMaint with production line and segment tags — enabling work order and inspection data to be analyzed by their position in the throughput flow, not just by asset ID.
Assign Asset Criticality Ratings
Classify each asset by its production impact in OxMaint — identifying which assets, if constrained, halt the line versus which reduce throughput partially. Constraint discovery prioritizes critical-path assets first.
Run Corrective WO Frequency Analysis
Use OxMaint's work order reporting to identify which assets generate the highest corrective maintenance frequency — creating the Pareto view that locates the maintenance-driven constraint tier.
Audit PM Compliance by Line Segment
Review PM completion rates across the production line in OxMaint to identify where deferred maintenance is building toward the next constraint event — acting before the downtime occurs.
Review Open Inspection Findings by Severity
Filter OxMaint inspection records for open high-severity findings on critical-path assets — identifying condition-based constraints in formation and prioritizing corrective action closure before failure.
Track Improvement Actions and Throughput Response
Log improvement work orders in OxMaint and track subsequent WO frequency and MTTR changes — validating whether constraint elimination actions produced measurable throughput gains. Book a Demo to see the full workflow.
Frequently Asked Questions
What is a production constraint discovery framework in maintenance?
It is a structured approach using maintenance data — work order history, PM compliance, inspection findings — to identify which assets or resources are limiting production throughput and prioritize improvement actions by operational impact.
How does OxMaint support bottleneck analysis on the plant floor?
OxMaint tracks corrective work order frequency, PM compliance rates, downtime duration, and inspection findings per asset — giving teams the cross-asset data needed to locate throughput constraints without separate production analytics tools.
What is the fastest way to identify production constraints from maintenance records?
Run a Pareto of corrective work order frequency by asset. Assets generating the top 20% of work orders typically drive the majority of unplanned downtime — and OxMaint makes this analysis available directly from work order history without manual aggregation.
How does deferred PM create production constraints?
Deferred PM allows component degradation to progress unchecked until an unplanned failure occurs — converting a preventable scheduled event into an unscheduled downtime event that constrains throughput at the worst possible time.
Can OxMaint measure whether constraint improvements actually increased throughput?
Yes. OxMaint tracks work order frequency and MTTR before and after improvement actions per asset — making the maintenance-side contribution to throughput recovery measurable over time through the asset's work order history.
Turn Maintenance Data into Production Throughput Gains
OxMaint gives industrial teams the asset records, PM tracking, and inspection history to locate and eliminate production constraints before they compound into scheduled losses no one questions anymore.