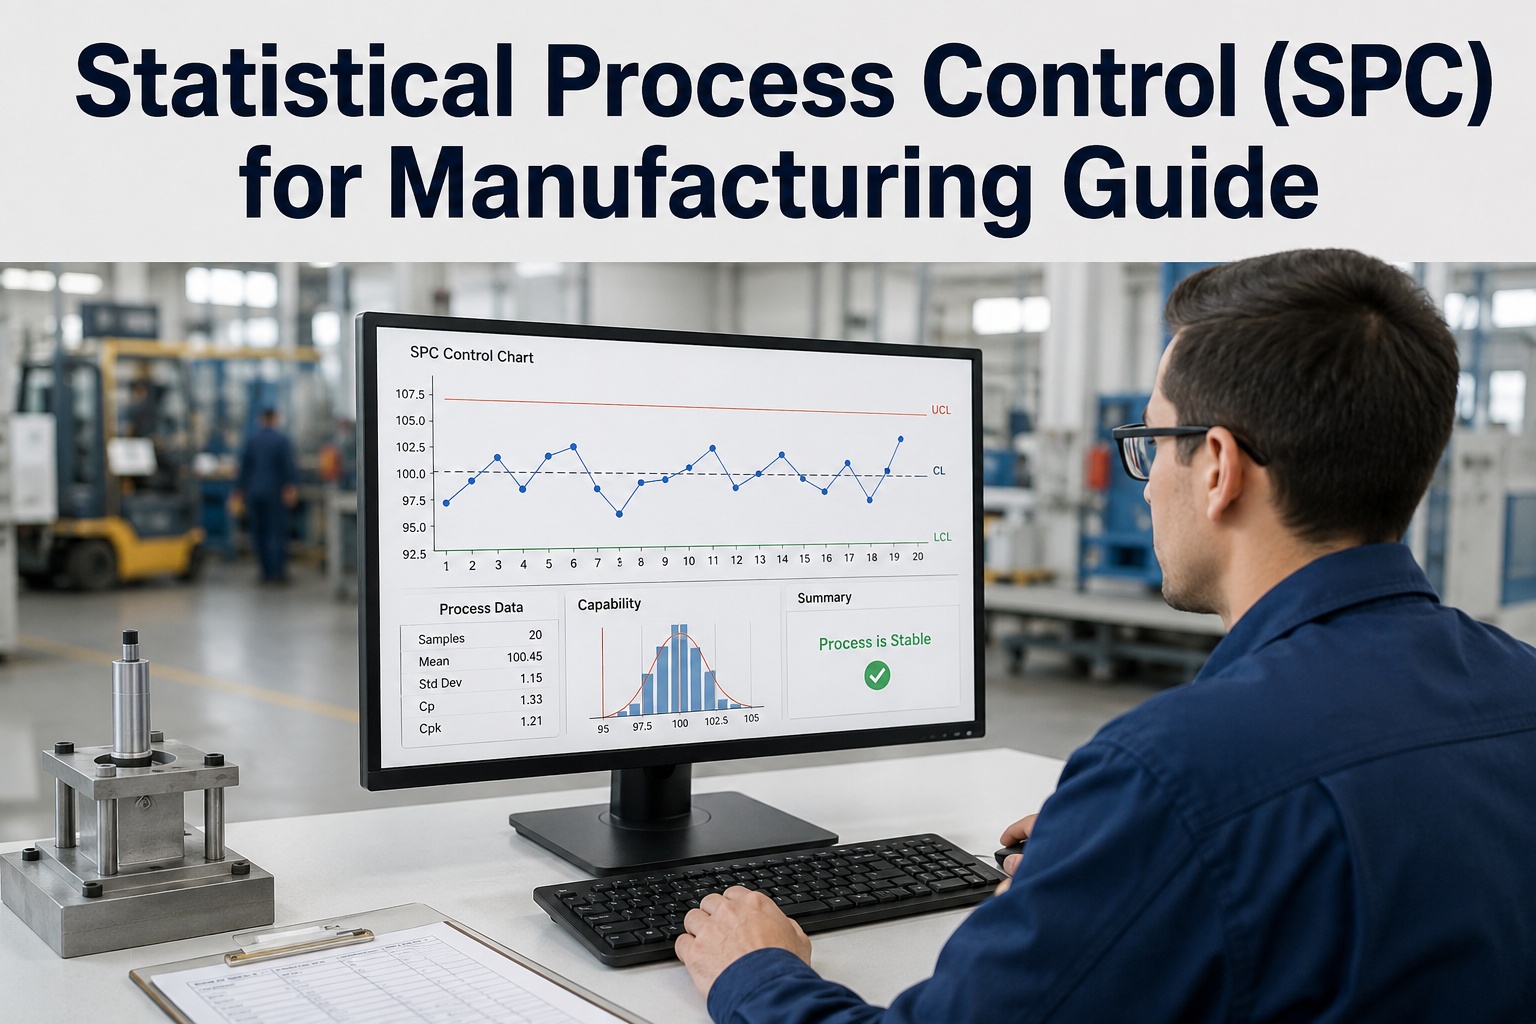
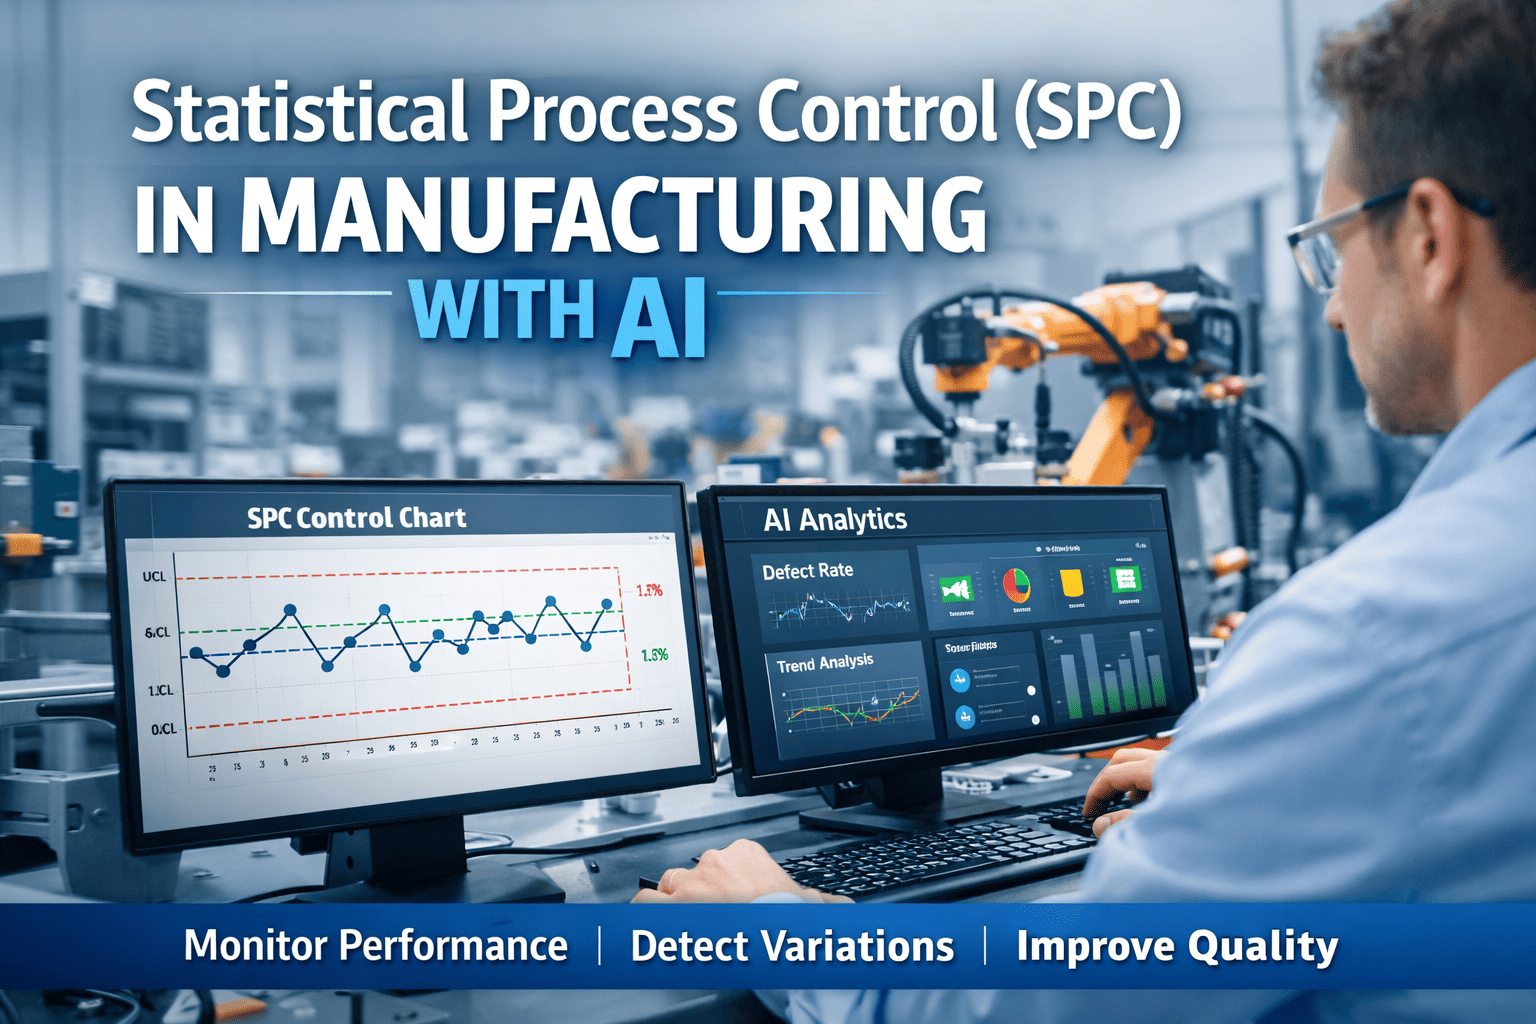
A predictive quality deployment framework for plants is the repeatable structure that packages sensor data collection, statistical thresholds, escalation rules, and response ownership into one rollout playbook — instead of leaving each production line to build its own ad hoc quality monitoring approach. For quality and operations leaders, an undefined deployment framework is not a planning inconvenience — it is the reason control charts get configured inconsistently, alerts go to the wrong owner, and defects keep reaching the customer before anyone reviews the data. Sign Up Free to see how OxMaint packages sensor-based control charts, real-time alerts, and closed-loop corrective action into a deployable predictive quality framework for every plant.
Deploy a Predictive Quality Framework with OxMaint
Real-time control charts. Automatic threshold calculation. Instant alerts. Closed-loop work orders. OxMaint gives plants a repeatable framework for catching defects before they happen.
Why Predictive Quality Rollouts Stall in Plant Operations
Most predictive quality initiatives fail to scale past a pilot line because the deployment was never structured as a repeatable framework in the first place. Book a Demo to see how OxMaint's statistical quality control module standardizes the rollout from the first sensor to the first corrective action.
Control Chart Type Chosen Inconsistently
Different lines selecting different chart types for the same kind of measurement data make cross-line quality comparison meaningless and confuse operators learning the system.
Thresholds Set Once and Never Revisited
Control limits calculated at initial setup and left unchanged as process conditions shift quietly stop reflecting the process they were meant to monitor.
Escalation Routed to the Wrong Owner
Out-of-control alerts sent to a generic distribution list rather than a defined response owner mean critical quality signals sit unread until a batch is already rejected.
Sensor Data Source Not Standardized
Mixing manual entry, spreadsheet uploads, and live IoT feeds across different lines without a consistent data source policy introduces noise that masks genuine process shifts.
No Link Between Detection and Corrective Action
A control chart that flags an out-of-control point but does not automatically trigger a work order leaves the gap between detection and correction dependent on someone remembering to act.
Pilot Line Success Never Documented for Scale-Up
Without a written deployment framework, lessons learned on a successful pilot line are rarely captured well enough to replicate on the next line, plant, or shift.
Predictive Quality Deployment Framework — Core Stages
A deployable predictive quality framework moves through six defined stages for every line it touches. Sign Up Free to run this exact workflow inside OxMaint's quality control module.
| Deployment Stage | What It Establishes | OxMaint Feature | Readiness Indicator |
|---|---|---|---|
| Data Collection | Standardized sensor and manual data source per measurement | IoT Sensor & Manual Data Input | One defined data source per control point |
| Chart Selection | Correct control chart type for the measurement and subgroup size | Auto Chart Selection Engine | Chart type validated against data characteristics |
| Threshold Calculation | Upper and lower control limits and center line | UCL/LCL Control Limit Engine | Limits recalculated when process conditions change |
| Real-Time Alerting | Defined escalation path for out-of-control points | Instant Notification Rules | Every alert routed to a named response owner |
| Corrective Action | Automatic work order generation from detected defects | Closed-Loop Quality Workflow | Zero manual handoff between detection and the fix |
| Continuous Improvement | Root cause capture feeding the next deployment cycle | DMAIC & Root Cause Tools | Documented learnings carried into the next line rollout |
How OxMaint Supports Predictive Quality Deployment
Auto Chart Selection and Control Limit Calculation
OxMaint automatically recommends the optimal control chart type based on measurement type and subgroup size, then calculates UCL, LCL, and center line so every line starts from a statistically sound baseline. Book a Demo to see chart configuration for your own production line.
Real-Time Alerts With Defined Escalation
Out-of-control conditions trigger instant notifications using Western Electric and Nelson rules, routed to a configured response owner instead of a generic alert queue that no one is accountable for.
Closed-Loop Defect-to-Work-Order Workflow
When a control chart detects an issue, OxMaint automatically generates a work order linked to the specific asset and quality event, removing the manual handoff that delays corrective action. Sign Up Free to activate closed-loop quality workflows for your plant.
DMAIC Toolkit for Documented Scale-Up
Built-in Define, Measure, Analyze, Improve, Control workflows with Pareto and fishbone analysis give every pilot deployment a documented improvement record that can be replicated on the next line.
Predictive Quality Deployment Results in Plant Operations
Defect Reduction Replicated Across Three Lines
Escalation Ownership Closed the Response Gap
Process Capability Improved to Six Sigma Range
Closed-Loop Workflow Removed Manual Handoffs
Step-by-Step: Rolling Out Predictive Quality in OxMaint
Standardize the Data Source for Each Measurement Point
Decide whether each control point will be fed by an IoT sensor or manual entry, and configure that data source consistently before any chart is built. Book a Demo to plan data source configuration for your plant.
Let Auto Chart Selection Recommend the Right Chart Type
Use OxMaint's auto chart selection to match X-bar & R, X-bar & S, P, NP, C, or U charts to each measurement type rather than choosing manually line by line.
Configure Escalation Rules With a Named Response Owner
Assign every control point's out-of-control alert to a specific role or individual rather than a shared queue, so accountability for response time is unambiguous.
Connect Control Charts to the Closed-Loop Work Order Flow
Enable automatic work order creation from detected defects so the path from statistical alert to physical correction requires no manual step in between.
Document the Rollout and Repeat on the Next Line
Capture root cause findings and configuration decisions using the DMAIC toolkit so the next line, shift, or plant can follow the identical framework rather than starting from scratch.
Key Metrics for Predictive Quality Deployment Success
These metrics confirm whether the deployment framework is actually catching defects earlier, not just generating more charts. Book a Demo to track these metrics across every deployed line.
Defect Detection Lead Time
Time between a process shift beginning and the control chart flagging an out-of-control condition, the core measure of predictive value.
Alert Response Time
Average time from alert generation to corrective action initiated, showing whether escalation ownership is actually working.
Process Capability Index (Cpk)
Direct measure of how well each line meets specification limits, tracked before and after framework deployment.
PPM Defective Rate
Parts per million outside specification, the clearest external indicator of whether the framework is reducing customer-facing defects.
Closed-Loop Completion Rate
Percentage of detected defects that result in a completed corrective work order, confirming the loop between detection and action is not breaking down.
Deployment Replication Speed
Time required to bring a new line onto the same framework, the measure of whether the deployment is genuinely repeatable rather than bespoke each time.
Make Predictive Quality a Repeatable Framework, Not a Pilot
Auto chart selection, defined escalation ownership, closed-loop corrective action, and DMAIC documentation — OxMaint gives plants a deployment framework built to scale beyond one line.
Frequently Asked Questions
What is a predictive quality deployment framework?
It is a repeatable structure covering sensor data sources, control chart selection, alert thresholds, escalation ownership, and corrective action workflow, used to roll out predictive quality monitoring consistently across multiple lines or plants.
How does OxMaint support a predictive quality framework?
OxMaint's statistical quality control module automates chart selection, calculates control limits, routes real-time alerts to a named owner, and auto-generates work orders from detected defects in one connected workflow.
Why do predictive quality pilots fail to scale?
Pilots usually fail to scale because configuration decisions and lessons learned were never documented in a repeatable framework, leaving each new line to start its setup from scratch.
What control chart types does OxMaint support?
OxMaint supports X-bar & R, X-bar & S, Individual-Moving Range, and EWMA charts for variable data, plus P, NP, C, and U charts for attribute data, with automatic chart type recommendation.
How does closed-loop quality work in OxMaint?
When a control chart detects an out-of-control condition, OxMaint can automatically generate a work order linked to the affected asset, removing the manual step between detection and correction.
Can the framework be reused across multiple plants?
Yes, the same data source, chart selection, escalation, and closed-loop workflow stages can be replicated on every new line or plant, which is the core purpose of treating quality deployment as a framework rather than a one-off project.
Give Your Plants a Quality Framework That Scales
OxMaint delivers real-time control charts, automated thresholds, defined escalation, and closed-loop corrective action for plants ready to deploy predictive quality beyond a single pilot line.