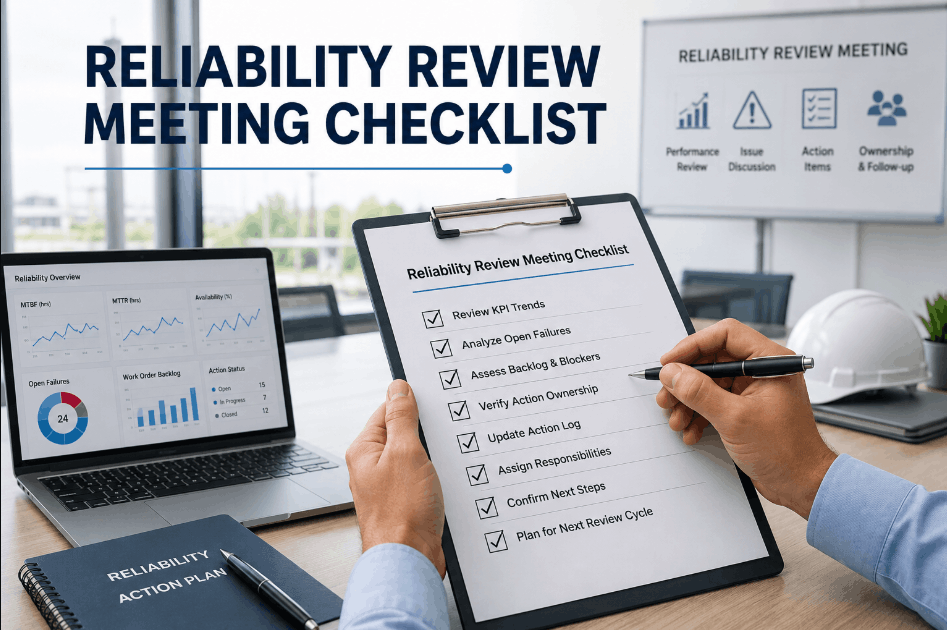
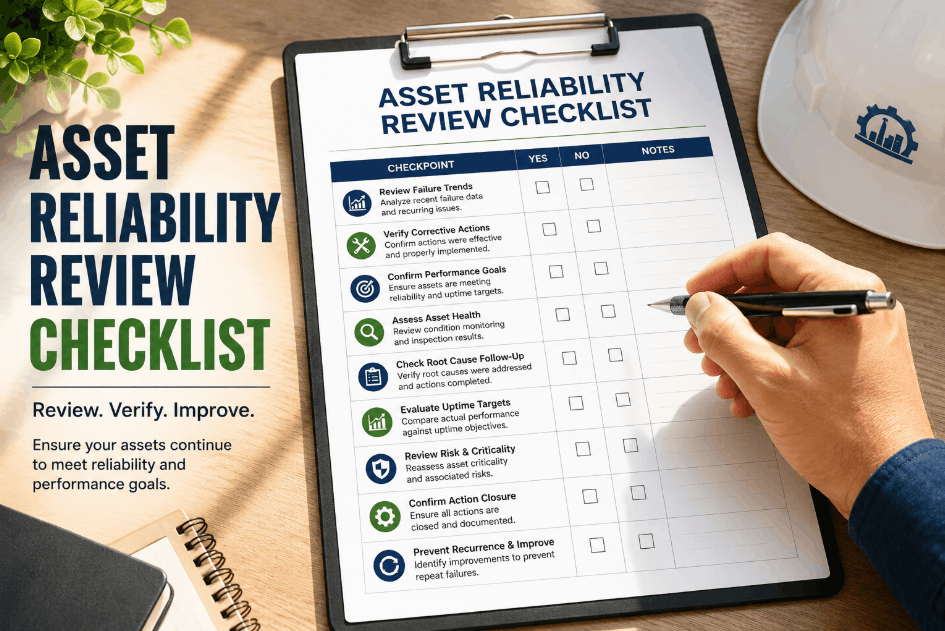
Maintenance KPI storyboards give supervisors a single management view that highlights backlog, response lag, and uptime drift at a glance, instead of forcing them to dig through scattered spreadsheets and disconnected reports. Most supervisors only learn a crew is falling behind once the backlog has already piled up or downtime has already hit production targets. Oxmaint's analytics and reporting dashboards turn live work order, asset health, and PM compliance data into a storyboard view that flags risk early. Sign Up Free to start building your own KPI storyboard, or Book a Demo to see Oxmaint's supervisor dashboards in action.
See Backlog and Risk Before It Piles Up
Oxmaint's analytics dashboards turn live work order and asset data into a single supervisor view of backlog, response lag, and uptime drift.
Why Supervisors Need a Single KPI View
Backlog, response lag, and uptime issues rarely show up in one place — a supervisor checking only completed work orders misses overdue PMs building up elsewhere in the plant. Book a Demo to see how Oxmaint consolidates these signals into one storyboard view supervisors can check daily.
Four KPIs Every Supervisor Storyboard Should Track
A useful KPI storyboard focuses on a small set of metrics that point directly to action, not a wall of charts nobody checks. Oxmaint's reporting layer surfaces these metrics automatically from live work order and asset data. Sign Up Free to configure your supervisor view with the KPIs your team needs most.
Open Work Order Backlog
Oxmaint tracks open and aging work orders by priority and asset, so supervisors see backlog building before it becomes unmanageable.
Response and Resolution Lag
Real-time work order timestamps let supervisors compare average response and resolution times against targets, by crew or shift.
Asset Uptime and Health Drift
Predictive health scores show which assets are trending toward risk, giving supervisors a forward-looking view beyond past downtime.
Overdue PM Compliance
Oxmaint flags overdue preventive maintenance across plants and assets, surfacing compliance gaps before they cause a breakdown.
Building a Supervisor KPI Storyboard in Oxmaint
Centralize Work Order Data
Bring all work orders, labor, and parts logging into Oxmaint so backlog and response metrics calculate from one consistent source.
Connect Predictive Health Scores
Link sensor and AI Vision data so uptime drift appears on the storyboard before assets actually fail.
Configure the Supervisor Dashboard
Select the backlog, lag, and compliance KPIs that matter most for your plant, filtered by crew, shift, or location.
Review and Act Daily
Use the AI-generated shift summaries and analytics reports to turn the storyboard into daily action, not a static report.
Give Every Supervisor a Clear, Daily Risk View
Oxmaint turns backlog, response lag, and uptime drift into one simple storyboard supervisors can check at a glance.
Frequently Asked Questions: Maintenance KPI Storyboards
What is a maintenance KPI storyboard?
It is a single dashboard view that highlights backlog, response lag, and uptime drift so supervisors can spot risk at a glance.
How does Oxmaint build supervisor dashboards?
Oxmaint pulls live work order, asset health, and PM compliance data into configurable analytics and reporting dashboards.
Can the storyboard be filtered by crew or shift?
Yes. Supervisors can view backlog, response lag, and compliance KPIs filtered by crew, shift, plant, or asset type.
Does the storyboard include predictive risk signals?
Yes. Predictive health scores from connected sensors and AI Vision feed directly into the uptime drift view.
Is this useful for multi-plant operations?
Yes. Oxmaint dashboards can roll up KPIs across multiple plants while still allowing drill-down to a single crew or asset.
Turn Raw Maintenance Data Into a Daily Action View
From centralized work orders to predictive health scores, Oxmaint gives supervisors the structured KPI storyboard needed to manage backlog, lag, and uptime before they become bigger problems.