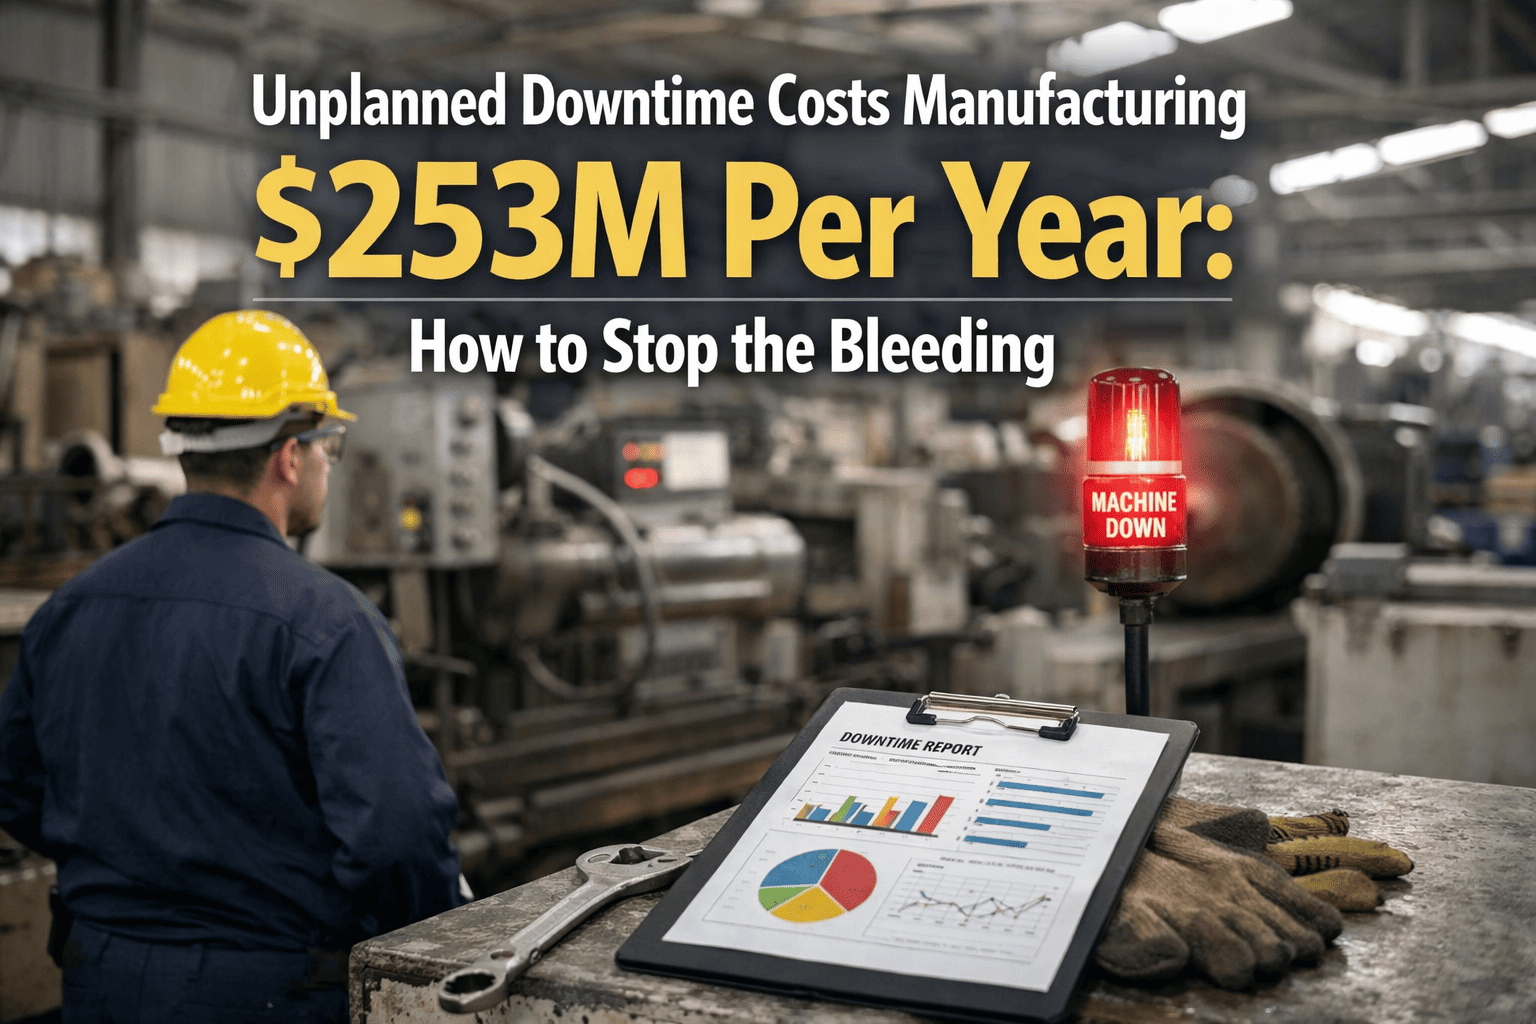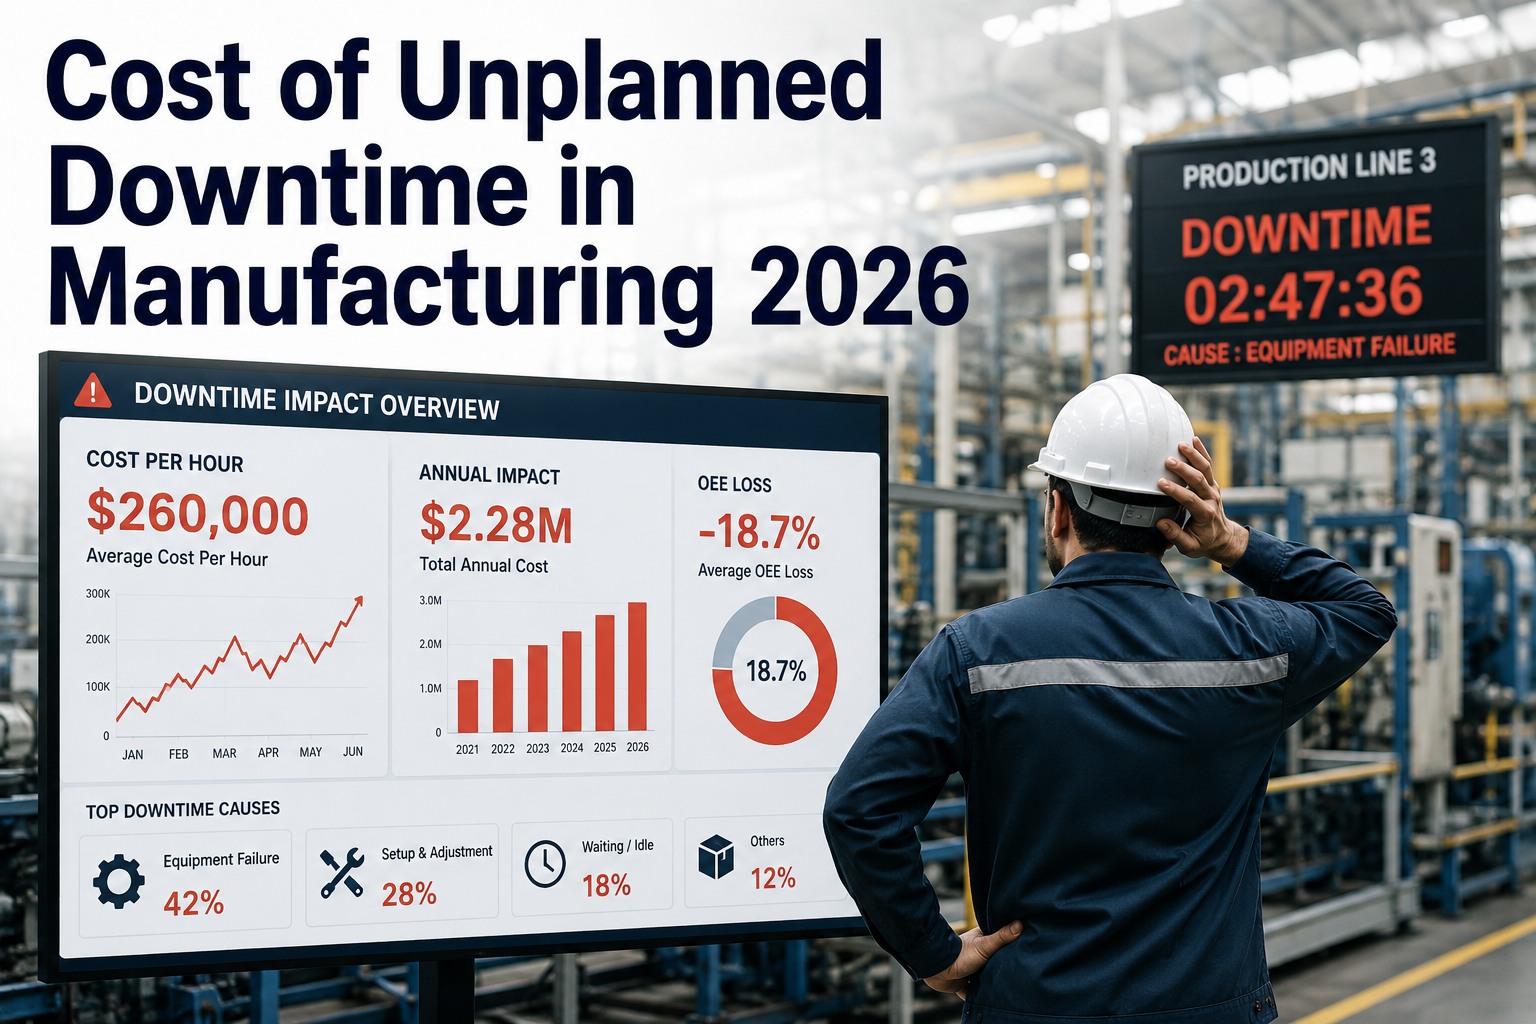
Every manufacturer knows unplanned downtime hurts. Fewer than 25% know precisely what it costs their plant per hour — and that gap in precision is itself expensive, because you cannot systematically reduce a cost you have not actually measured. The 2026 numbers are unambiguous. Aberdeen Research puts the manufacturing-wide average at $260,000 per hour of unplanned downtime. Automotive assembly runs past $2.3 million per hour. Semiconductor fabrication averages $1.8 million per hour and touches the millions on leading-edge wafer lines. A single pharma batch invalidation from a downtime event runs $9 million or more per incident. FMCG sits at $36,000 per hour and food and beverage at roughly $85,000 per hour. And the compounding is real — each hour of unplanned downtime costs roughly 50% more today than in 2019, driven by tightly coupled supply chains where a single stoppage cascades through Tier 1 and Tier 2 suppliers. Fortune Global 500 companies now lose $1.4 trillion annually to unplanned downtime, equivalent to 11% of total revenue, with per-facility cost up 65% since 2019-20. Below is the working 2026 benchmark by sector, the fully-loaded cost anatomy (direct costs are only 30–40% of the total), the formula to calculate your specific plant's number, and the AI-native RCM approach that consistently delivers 30–50% unplanned downtime reduction within 12 months. Start free and stand up downtime cost tracking on one production line this week, or book a demo to benchmark your specific plant against sector data.
Manufacturing · Reliability Economics · Aberdeen / Siemens / ABB · 2026
Cost of Unplanned Downtime in Manufacturing 2026
The updated benchmarks by sector, the fully-loaded cost formula (direct costs typically represent only 30–40% of the real number), and the AI-native predictive maintenance approach cutting unplanned downtime 30–50% within 12 months. Data anchored to Aberdeen, Siemens True Cost of Downtime 2024, ABB Value of Reliability 2023, and Deloitte Insights.
-
$260K/hr
manufacturing-wide average cost of unplanned downtime (Aberdeen)
-
$1.4T
annual aggregate loss across Fortune Global 500 manufacturers
-
11%
of annual revenue lost by the world's largest manufacturers to downtime
-
+50%
how much more each downtime hour costs today vs 2019 baseline
Sector Benchmarks
2026 Cost per Hour — the Working Comparison
Averages hide the story. A small custom job shop and a leading-edge wafer fab both make things — and the cost of an hour of stopped production between them varies by three orders of magnitude. This is the working sector map, anchored to Siemens True Cost of Downtime 2024, ABB Value of Reliability 2023, and Aberdeen Research. Find your sector; that is your minimum starting number.
| Sector | Cost per Hour (Direct) | Primary Driver | Source Anchor |
|---|---|---|---|
| Semiconductor fabrication | $1.8M – $2M+/hr | Wafer scrap, cleanroom recovery, tool bottleneck | Siemens TCOD 2024 |
| Automotive assembly | $2.3M/hr | JIT supply cascade, Tier 1/2 penalty | Aberdeen / Siemens |
| Oil & gas production | $250K – $500K/hr | Continuous-process throughput loss | ABB |
| Pharmaceutical | $9M+/incident | Batch invalidation, FDA re-validation | Augury 2024 |
| Food & beverage | $85K/hr | Spoilage, sanitation restart, contract fill | ABB VoR 2023 |
| FMCG | $36K/hr | Low-margin volume, retail penalty | Siemens TCOD 2024 |
| General discrete manufacturing | $10K – $50K/hr | Line-item throughput, labour idle | Deloitte / Aberdeen |
| Light assembly / job shop | $5K – $22K/hr | Direct margin loss, overtime recovery | Innovapptive 2026 |
The Fully-Loaded Cost
Why the Headline Number Is Only 30–40% of the Real Cost
When plants report their downtime cost, they typically count lost production and repair expenses — the visible costs. The hidden costs almost always exceed the visible ones by two to three times. This is the working anatomy — the seven cost buckets that make up the fully-loaded number, ranked by the share they typically represent of the total.
- 28%
01 · Lost Production Revenue
Units not produced × unit contribution margin, across the downtime window. The visible number most plants track — and typically all they track.
- 14%
02 · Idle Direct Labour
Operators, materials handlers, quality inspectors paid while the line is down. Loaded wage × headcount × downtime hours.
- 12%
03 · Emergency Repair Premium
Overtime labour rates, expedited freight on spare parts, third-party emergency contractor rates — routinely 3–5× planned-maintenance cost.
- 11%
04 · Scrap & Work-in-Process Loss
Product in progress that cannot be recovered — batches contaminated on a pharma line, half-processed WIP on a discrete line, unshipped inventory buffers.
- 10%
05 · Downstream Supply-Chain Cascade
Late shipments, contract penalty clauses, expedited customer freight, buffer-inventory reduction. Biggest in JIT sectors — automotive most exposed.
- 9%
06 · Restart & Recovery Costs
Cleanroom re-qualification, sanitation restart in F&B, warm-up curves in continuous process, initial-run quality holds — the tail on every unplanned event.
- 16%
07 · Second-Order Effects
Compounded maintenance backlog, planning-team disruption, root-cause investigation labour, and the reliability programme falling further behind because the maintenance team is firefighting.
Rule of thumb: multiply your visible direct cost (buckets 1–3) by 2.5× to approximate the fully-loaded number. A $260K/hr headline is often a $650K/hr real cost.
Calculate Your Number
The Formula for Your Specific Plant
Sector averages are the starting point. Your actual number depends on your production output rate, unit margin, labour structure, and contract exposure. Below is the working formula every reliability leader should be able to answer within an hour — plus a simplified estimator for the plants that have not calculated it before.
Cost of Downtime per Hour
Best-in-class plants track this at the asset level in the CMMS — every unplanned event auto-tagged with cost by line, shift, and root cause.
If You Have Never Calculated Yours
This estimator gives you a defensible floor. Real cost is typically 2–3× this figure once labour, overhead, and cascade effects are included.
The Root Cause
42% of Unplanned Downtime Is Equipment Failure — the Category Predictive Maintenance Catches
Equipment failure is the single largest cause of unplanned downtime — 42% of all incidents. It is also the category most responsive to AI-native predictive maintenance and condition-based RCM. Deloitte Insights research finds systematic predictive and IoT-based monitoring cuts unplanned downtime 30–50%. On a plant losing $260K per hour, the ROI arithmetic is straightforward. Oxmaint runs continuous FMEA, live criticality, and condition-triggered work orders as first-class workflows — turning the cost of downtime from a budget-line surprise into a measurable, reduceable operating metric.
Where the Reduction Comes From
The 30–50% Cut — Broken Down by Lever
The Deloitte-referenced 30–50% unplanned-downtime reduction is not one intervention. It is a stack of specific, quantifiable levers a modern CMMS operationalises. Below is the working attribution — where the hours actually get recovered.
Condition-Based PM
Sensor thresholds trigger work orders at the P-detection point — hours or days before functional failure. The largest single lever, and the one most responsive to AI-native RCM.
Failure-Finding Tasks
Hidden-function testing on safety-instrumented systems and standby equipment — catches "double-failure" exposure before the primary asset fails.
MTTR Reduction
Structured mobile work orders with parts, procedures, and photo history at the technician's hand cut mean time to repair sharply on the events that still occur.
Retired Ineffective PMs
20–30% of legacy calendar PMs never prevented a failure. Retiring them stops the infant-mortality failures that overhaul work itself introduces.
Cross-Shift Continuity
Digital handover eliminates the "known fault never handed over" pattern — the top-cited human factor in maintenance error.
Built for Reliability Leaders
How Oxmaint Turns Downtime Cost Into a Managed Metric
-
Auto Cost-Tagging
Every Downtime Event Priced by Asset, Line, and Shift
Downtime tracking captures every minute and auto-calculates cost using your production output rate, labour loading, and overhead structure. No manual reconstruction on Monday morning.
-
Condition Monitoring
Vibration, Thermal, Current Feeding the Same Record
IoT sensors flow into the same asset record as the CMMS. Condition data trends against P-F interval thresholds; work orders fire on evidence rather than calendar.
-
Root-Cause Tagging
Every Closure Tagged to Root Cause and Cost
Technicians close work orders with structured root-cause codes. Aggregated Pareto analysis surfaces the top 20% of failure modes driving 80% of your downtime cost.
-
SAP / Maximo Overlay
Preserves Your Existing ERP Investment
Overlay mode ingests asset hierarchy and WO state from SAP PM or IBM Maximo without replacement. AI-native RCM runs on top of your existing ERP.
-
Reliability Dashboard
MTBF, MTTR, and Cost Trending Live
Plant manager and reliability director dashboards show downtime hours, cost per event, and MTBF/MTTR trend by asset class — the operating metrics that move the P&L needle.
-
Free Forever Plan
Prove the Cost Model on One Production Line
Cloud-based, mobile-first. Start on the free forever plan, digitise downtime tracking on one critical line, prove the cost quantification, and scale to plant-wide when ready.
Measured Outcomes
What Plants Report in the First 12 Months
-
30–50%
Unplanned Downtime Reduction
Deloitte Insights benchmark for systematic predictive and IoT-based monitoring programmes when embedded in daily work-order flow.
-
3–5×
Cost Multiplier Eliminated
Unplanned downtime costs 3–5× the same repair executed during scheduled maintenance. Shifting work from unplanned to planned closes that multiplier.
-
20–30%
Calendar PMs Retired
Unnecessary PM tasks that never prevented a failure identified and safely retired — releasing maintenance labour capacity back to condition-based work.
-
$0
Free Forever Plan to Start
Cloud-based, mobile-first. Prove downtime cost tracking on one line, measure the reduction, and scale to plant-wide when the ROI is proven.
Frequently Asked
Downtime Cost Questions
Where does the $260,000/hr manufacturing average come from?
Aberdeen Research, validated by Siemens True Cost of Downtime 2024 and multiple 2025–26 corroborating studies. It is a manufacturing-wide average — your sector-specific number is more useful. Automotive sits at $2.3M/hr, semiconductor at $1.8M–$2M+/hr, FMCG at $36K/hr. Use the sector benchmark as your starting point, then apply the fully-loaded multiplier for your specific plant. Start free and calculate your specific number this week.
Why is the fully-loaded cost 2–3× the visible cost?
Because most plants only count lost production and repair expense — buckets 1 and 3 in the seven-part cost anatomy. Idle labour, scrap and WIP loss, downstream supply-chain cascade, restart and recovery costs, and second-order effects on the maintenance backlog together represent 55–65% of the total cost of a downtime event. Rule of thumb: multiply your visible direct cost by 2.5×.
Is a 30–50% reduction realistic in the first year?
Yes, per Deloitte Insights research on systematic predictive and IoT-based monitoring programmes. The word to notice is "systematic" — a predictive model whose outputs nobody acts on delivers zero benefit. The reduction comes when AI-native RCM is embedded directly in the daily work-order flow, so a P-detection alert becomes a dispatched work order with parts and procedures, not a report nobody reads. Book a demo to see the embedded predictive workflow.
Does this work alongside our existing SAP PM or Maximo?
Yes. Oxmaint runs in overlay mode. Asset hierarchy and work-order state ingest from SAP PM or IBM Maximo without replacement, and AI-generated work orders push back into your ERP for financial and stores integration. Your existing ERP investment is preserved; AI-native RCM sits on top of it.
Is there a free plan to prove downtime cost tracking on one line first?
Yes. Oxmaint offers a free forever plan — enough to digitise downtime tracking on one critical production line, auto-tag events by asset and cost, and prove the quantification. Cloud-based, mobile-first — no server procurement, no consulting engagement to get started. Sign up for the free plan and stand up downtime tracking on one line today.
Measure · Model · Reduce · Verify
You Cannot Reduce a Cost You Have Not Measured
The 2026 benchmarks are clear: $260K/hr on average across manufacturing, $2.3M/hr in automotive, $9M+ per incident in pharma, and each hour costing 50% more than in 2019. The plants closing that gap are the ones pairing accurate downtime cost data with AI-native predictive prevention — cutting unplanned downtime 30–50% within twelve months. Oxmaint operationalises the full cycle: measure the cost, predict the failure, dispatch the work order, verify the reduction.