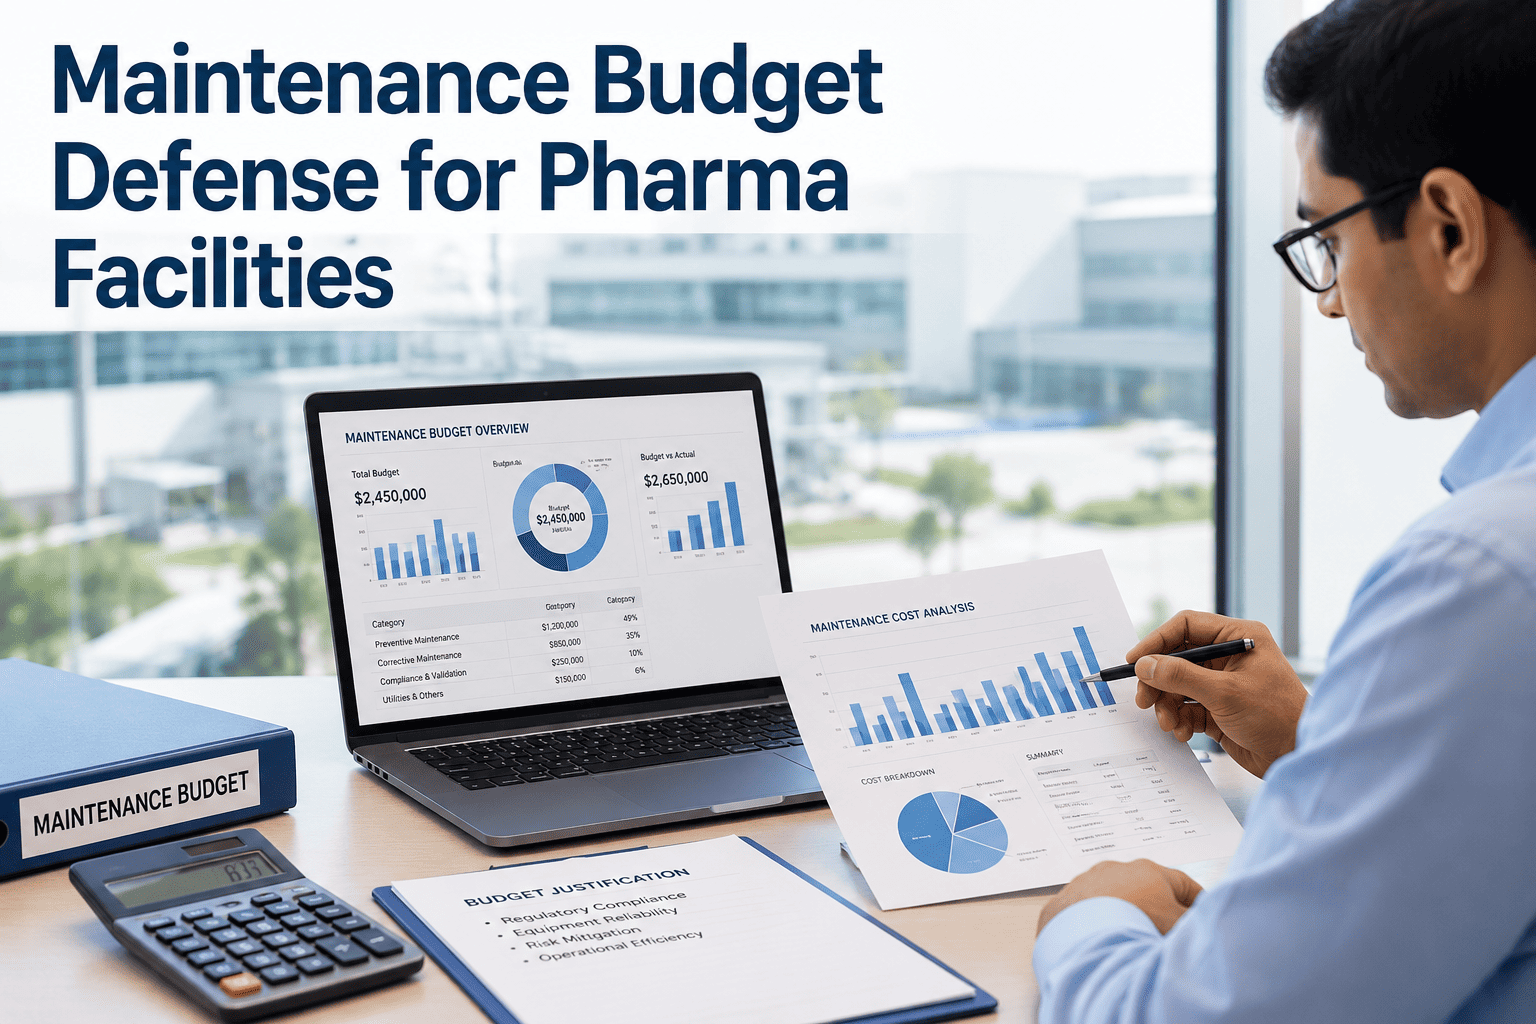
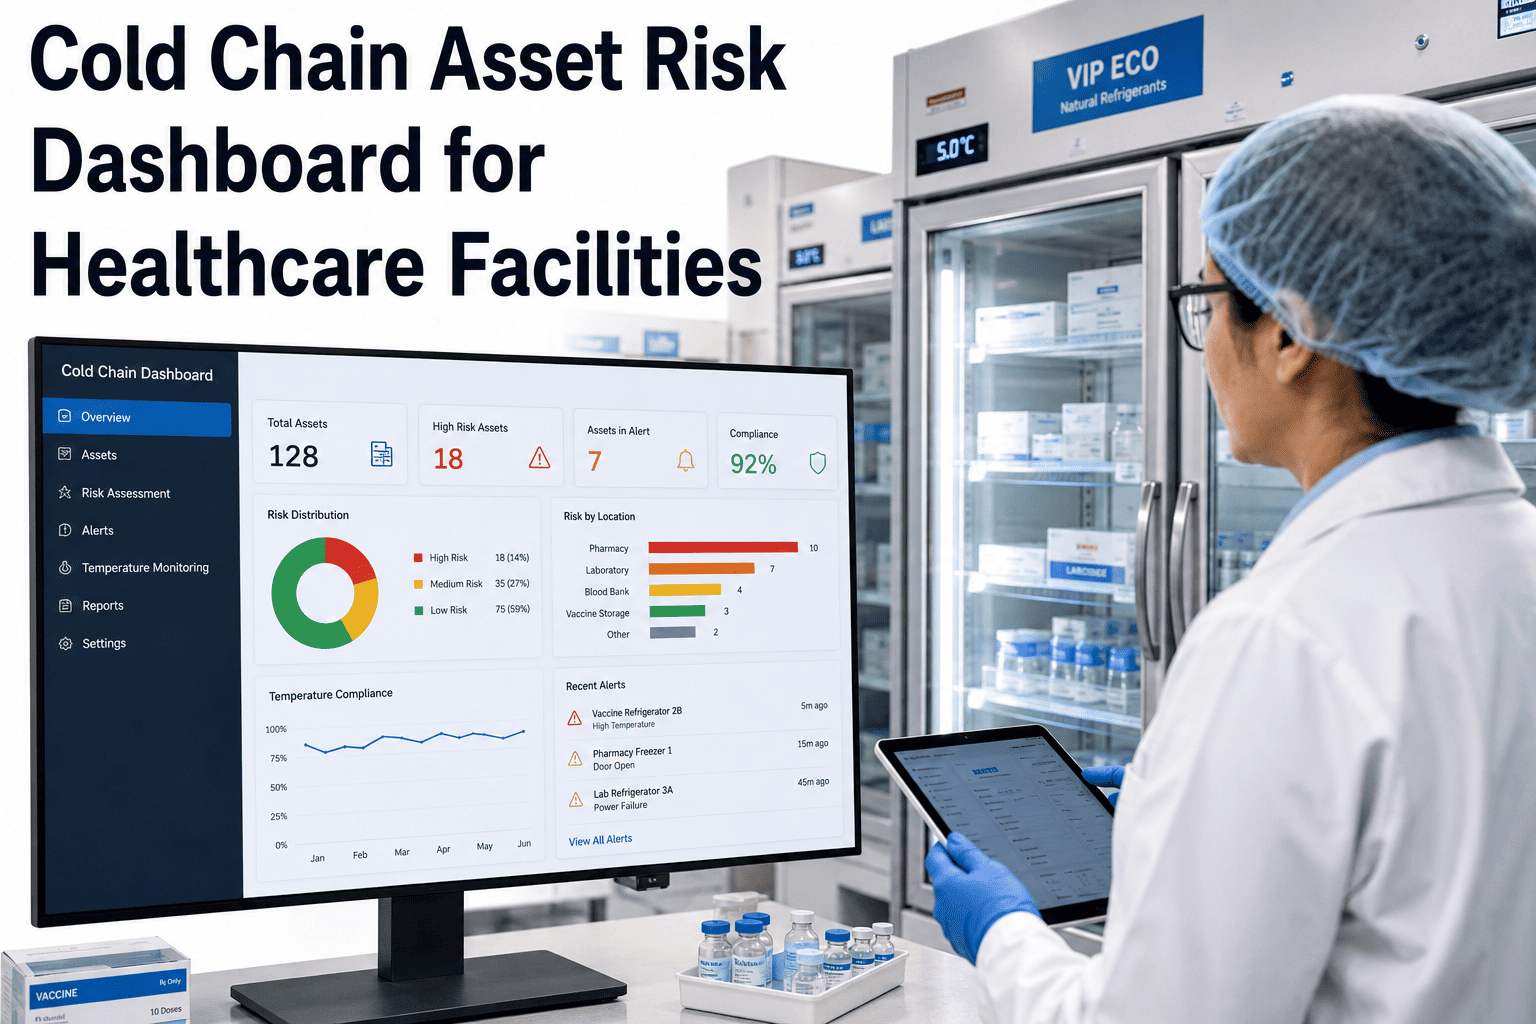
Pharma maintenance leaders face the same budget conversation every year: the finance team wants to cut, the maintenance director knows cutting creates risk, and neither side has the data to resolve the argument objectively. Book a demo with OxMaint to see how validated CMMS data transforms this conversation — turning asset risk scores, audit exposure records, spare part shortage history, and production downtime logs into a budget defense that finance directors understand and quality teams can stand behind. This guide gives pharma maintenance managers a structured methodology to build a budget case that survives CFO scrutiny, using the language of risk and revenue rather than headcount and hours.
Pharma Facilities · Maintenance Budget · Finance Case
How to Defend Your Maintenance Budget When Finance Wants to Cut It
Asset risk, audit exposure, spare part shortages, and production downtime cost — four data streams that turn a maintenance budget request into a risk management investment that no CFO can ignore.
The Budget Problem
Why Maintenance Budgets Lose Without Data — and Win With It
What Finance Hears (Without CMMS Data)
"We need the same budget as last year or equipment will fail."
"Our team is stretched and we can't absorb another cut."
"If we don't fix these assets now it will cost more later."
"The audit findings will be worse if we reduce the PM schedule."
What Finance Responds To (With CMMS Data)
14 assets rated critical risk — deferring PM on these carries $2.4M production exposure.
3 open audit observations requiring CAPA at $8K each — $24K in unavoidable remediation cost.
4 spare part stockouts in the last 12 months caused $318K in extended downtime.
Current reactive rate is 31% — industry data shows each 10pt reduction saves 22% on emergency labor cost.
The Four Pillars
Build Your Budget Case on Four Data Pillars Finance Cannot Argue With
1
Asset Risk Score and Criticality Matrix
Every asset in your facility carries a risk score based on failure probability, consequence of failure, and current PM status. OxMaint calculates and maintains this score automatically — and finance directors respond to "we have 14 assets in critical risk tier with deferred maintenance" very differently than they respond to "we need to maintain our equipment." Request the asset criticality report from OxMaint and use it as appendix A of your budget submission.
2
Audit Exposure and CAPA Cost History
Each audit observation that generates a CAPA has a fully loaded cost: investigation, documentation, remediation, and follow-up verification. Track these costs in OxMaint linked to the originating maintenance gap — PM overdue, calibration missed, record incomplete. When you can show finance that $48,000 in CAPA cost last year traced directly to deferred maintenance, the maintenance budget becomes a CAPA prevention investment with a documented return.
3
Spare Part Shortage and Extended Downtime Log
Spare part stockouts that extend repair time represent one of the most trackable and preventable maintenance costs. OxMaint logs every instance where a work order was delayed due to part unavailability — including the extended downtime hours and their production cost. A one-year stockout history showing three events and $318K in avoidable downtime is a compelling argument for maintaining or increasing the spare parts inventory budget line.
4
Production Downtime Trend and Cost Attribution
OxMaint links every unplanned production stoppage to a maintenance root cause — equipment failure, missed PM, parts shortage, or technician availability. The downtime cost report shows finance exactly what poor maintenance investment costs in production revenue terms — typically the most persuasive number in the entire budget conversation.
OxMaint · Maintenance Analytics · Budget Evidence
Stop Asking Finance for Budget. Start Showing Them the Risk Cost of Not Funding It.
OxMaint gives pharma maintenance teams the asset risk, downtime, audit exposure, and spare shortage data to build a budget case that finance approves the first time.
Budget Data Reference
Pharma Maintenance Cost Benchmarks to Anchor Your Budget Request
| Cost Item |
Industry Benchmark |
Source / Basis |
Budget Implication |
| Reactive vs Planned Maintenance Cost Ratio |
3–9× higher for reactive |
Uptime Institute; Plant Engineering 2023 |
Every 10pt drop in reactive % saves ~22% on emergency labor |
| Unplanned Downtime Cost (Pharma) |
$50K–$300K per hour |
ISPE Baseline Guide; Siemens OEE Report |
One prevented event often exceeds full annual CMMS cost |
| Average CAPA Cost (Maintenance-Related) |
$8,000–$22,000 per CAPA |
FDA Warning Letter analysis; PAREXEL benchmarks |
Reducing 4 CAPAs per year = $32–88K savings directly attributable to maintenance investment |
| PM Compliance Below 90% — Inspection Risk |
3.1× more audit observations |
FDA 483 trend analysis 2019–2024 |
PM budget cuts that drop compliance below 90% multiply audit cost, not reduce it |
| Spare Part Stockout — Avg Extended Downtime |
6.4 hours additional downtime per event |
Limble CMMS Industry Survey 2023 |
3 stockout events at $80K/hr = $1.54M avoidable downtime cost |
Budget Submission Template
One-Page Budget Defense Structure That Finance Directors Approve
Section 1
Current Asset Risk Exposure
Asset count by criticality tier. List of assets in High and Critical risk with current PM status. Total production exposure value tied to these assets. Source: OxMaint Asset Risk Report.
Section 2
Last 12 Months Downtime Cost
Number of unplanned stoppages. Total downtime hours and cost. Root cause breakdown (maintenance vs other). Trend line showing improvement or deterioration. Source: OxMaint Downtime Report.
Section 3
Audit and CAPA Cost History
Maintenance-related audit observations last 2 years. CAPA count and total loaded cost. Budget cut scenario — projected CAPA increase based on PM compliance drop. Source: OxMaint Audit Readiness Report.
Section 4
Budget Request with ROI Projection
Requested budget line items. Expected outcome for each line: reactive % reduction, downtime events prevented, CAPA cost avoided. Net ROI calculation showing positive return within 12 months. Source: OxMaint ROI Model.
"
The maintenance budget conversation changes completely when you walk into it with a downtime cost report, an asset risk matrix, and a CAPA cost history — all linked to specific maintenance decisions. Finance is not opposed to maintenance investment; finance is opposed to maintenance requests that cannot demonstrate return. Every dollar that prevents a $200,000 downtime event is a 200-to-one return. The problem is that most maintenance teams cannot show finance those numbers because they do not have a system that captures them. That is the core argument for a validated CMMS — not that it makes maintenance easier, but that it makes maintenance investment defensible.
James Achterberg
Pharmaceutical Plant Controller · 20 years in pharma finance and operations · Former CFO, Contract Manufacturing Organization · CPA, MBA Operations
FAQ
Maintenance Budget Defense — What Finance and Operations Teams Ask
What is the most persuasive single data point for a pharma maintenance budget request?
In most finance conversations, the downtime cost report wins. A specific dollar figure — "our three unplanned stoppages last year cost $486,000 in lost production and emergency labor" — is more persuasive than any percentage or ratio. OxMaint's downtime report links every stoppage to a root cause and assigns a cost figure based on production rate and repair labor, giving you a defensible number rather than an estimate.
Book a demo to see how OxMaint generates the downtime cost report.
How do we quantify the budget risk of a PM compliance drop from 90% to 80%?
FDA 483 observation data shows that sites with PM compliance between 80–90% receive 2.4× more maintenance-related audit observations than sites above 90%. If your current CAPA cost per audit cycle is $32,000, a 10-point PM compliance drop carries an expected audit cost increase of approximately $44,800. That figure, presented against the cost of maintaining the PM schedule, almost always justifies the maintenance budget line. OxMaint's PM compliance trend report gives you the current rate and projection model for any budget scenario you want to model.
Start a free trial to access PM compliance reporting.
Can OxMaint generate the specific reports needed for a budget submission to finance?
Yes. OxMaint includes four budget-ready reports: Asset Risk Summary (criticality tier, PM status, production exposure value), Downtime Cost Report (events, hours, cost, root cause), Audit Readiness Report (PM compliance, calibration status, open CAPAs with cost), and Reactive vs Planned Ratio Trend (12-month view with cost delta). All four can be exported as PDF or Excel for inclusion in a budget submission. The OxMaint pharma team can also help you structure the narrative around these data outputs if you are preparing for a board or finance committee presentation.
What happens to our budget defense if we cut the CMMS subscription as a cost reduction?
Cutting the CMMS subscription typically costs significantly more than it saves. Within 60–90 days of losing structured PM scheduling, compliance rates drop, reactive WO volume climbs, and audit observation risk increases. Sites that have decommissioned CMMS without a replacement report an average 23% increase in emergency maintenance spend and 1.8 additional audit observations in the subsequent inspection. The payback period for reinstating a CMMS after a gap period is also longer because data quality deteriorates and revalidation is required under 21 CFR 11 if the system is computerized.
Book a demo to discuss CMMS continuity planning for your site.
OxMaint · Pharma CMMS · Budget Defense Ready
Your Next Budget Meeting Needs Data, Not Arguments. OxMaint Has Both.
Asset risk reports, downtime cost logs, CAPA history, and reactive maintenance trend — OxMaint gives pharma maintenance teams every number they need to defend the budget and get it approved.