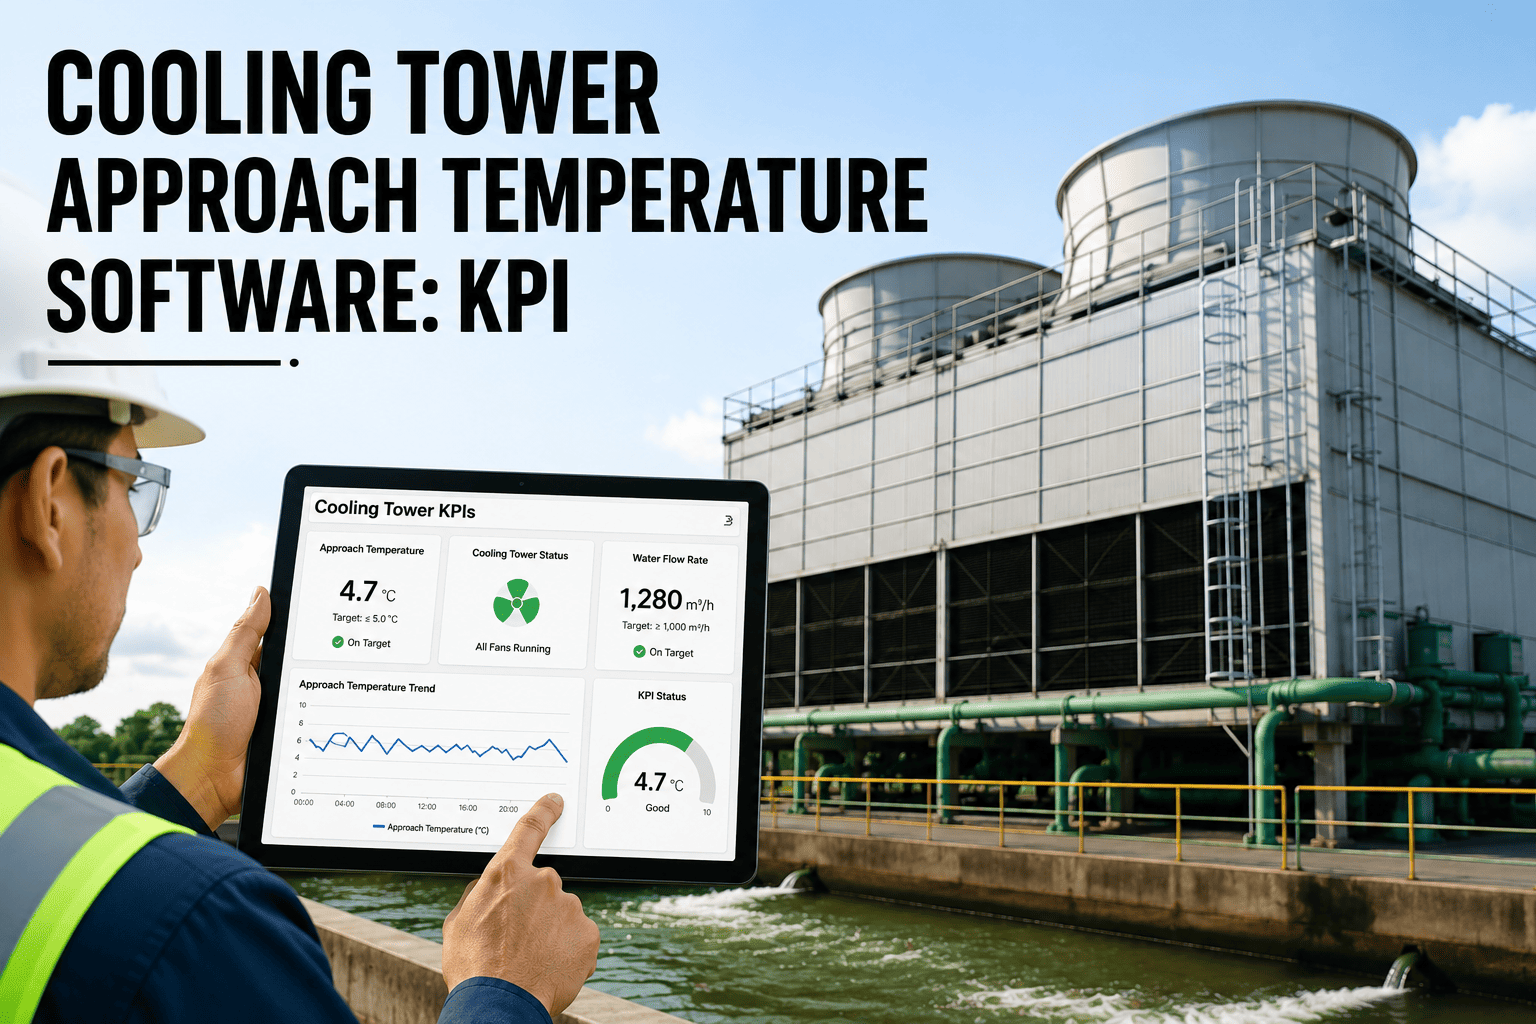
Cooling tower approach temperature is the single number that tells you how close your condenser water is coming to the theoretical limit set by the outdoor wet bulb temperature — and when that number drifts upward by just two to five degrees, it is almost always the first measurable sign of scale, biological fouling, or fill degradation building inside the tower, long before a chiller trips or an energy bill spikes. Most facility teams still write approach readings on a paper log once a shift, if they log the reading at all, which means the slow degradation trend that predicts a fouling event weeks in advance goes completely unnoticed until the plant is already running hot and the chiller compressor is working overtime to compensate. A cooling tower approach temperature software platform closes that gap by capturing every reading automatically, comparing it against the tower's original design approach, and surfacing the drift as a work order before it becomes a capacity or energy problem. Sign in to OxMaint to see how automated approach temperature tracking runs across every cooling tower in your facility.
Cooling Tower Software · Approach Temperature KPI · Scaling & Fouling Detection · OxMaint CMMS
The 2°F to 5°F Approach Drift Is the Earliest Warning Your Cooling Tower Gives You. Most Facilities Never See It Coming.
OxMaint logs cold water outlet temperature and ambient wet bulb temperature at every reading, calculates approach automatically, trends it against your tower's design value, and opens a fouling or scaling investigation the moment the KPI degrades beyond a safe threshold — so chiller efficiency loss shows up on a dashboard, not on next month's utility bill.
5–7°F
is the standard design approach for most HVAC and industrial cooling towers under clean, well-maintained conditions
2–3%
chiller compressor energy saved for every degree the condenser water approach temperature is reduced through better maintenance
2–5°F
degradation above design approach is the recognised early signal of scaling, fouling, or fill damage inside the tower
+5°F
A cooling tower approaching five degrees above its design approach is not experiencing a sudden failure — it is showing the accumulated result of weeks of scale buildup on fill surfaces, biological growth in the water distribution system, or clogged nozzles restricting airflow. Every one of these conditions is measurable well before the tower stops meeting its cooling duty. The problem is that most facilities only calculate approach temperature manually, occasionally, and inconsistently — so the degradation trend that would have flagged the issue at day ten is invisible until day forty, when the chiller plant is already losing capacity on the hottest day of the year.
What Approach Temperature Actually Tells a Facility Team
DEFINE
Approach vs. Range — Two Numbers That Measure Different Things
Cooling tower range is the temperature drop across the tower — hot water inlet minus cold water outlet — and it reflects the heat load and water flow rate passing through the system. Approach temperature is different: it is the cold water outlet temperature minus the ambient wet bulb temperature, and it reflects how efficiently the tower itself is transferring heat to the air. A tower can have a perfectly normal range while its approach is quietly climbing, which is exactly why teams that only watch supply and return temperatures miss the early fouling signal that approach temperature reveals. OxMaint calculates both values from every logged reading and keeps them on separate trend lines so a rising approach never gets masked by a stable range.
BENCH
What a Healthy Approach Reading Looks Like by Tower Type
Under clean design conditions, industrial and HVAC cooling towers typically run a 5°F to 7°F approach, with high-performance or oversized towers reaching 2°F to 4°F above wet bulb. Once approach climbs past roughly 6°F to 7°F over the tower's original design value, it generally signals inefficiency, fouling, or an undersized condition that needs investigation rather than normal seasonal variation. Because wet bulb temperature swings with weather while a clean tower's approach to that wet bulb stays comparatively stable, a rising approach trend — not a rising outlet temperature alone — is the number worth watching every week.
IMPACT
Why a Few Degrees of Approach Drift Changes Chiller Energy Cost
Colder condenser water entering the chiller directly improves compressor efficiency, because the chiller does not have to work as hard to reject heat against a lower condensing temperature. Facilities that reduce their operating approach from around 7°F toward 4°F commonly see chiller compressor energy consumption drop by roughly two to three percent per degree of improvement. Run that in reverse and a tower that has drifted five degrees above its design approach because of fouling is quietly adding real, avoidable dollars to every month's utility bill — dollars that never get traced back to the cooling tower unless approach is tracked as a standing KPI.
CAUSE
What Actually Pushes Approach Temperature Off Design
Scale deposits on fill media insulate the water film from the airstream and reduce the surface area available for evaporative heat transfer. Biological growth and slime do the same thing while also restricting nozzle flow and creating uneven water distribution across the fill. Clogged or worn nozzles create dry spots on the fill deck, air recirculation from poor tower placement raises the effective entering wet bulb, and a partially blocked strainer starves flow to the distribution basin. Each of these has a distinct fingerprint in the approach trend, which is why a single reading tells you little and a logged trend tells you almost everything.
A Rising Approach Trend Is a Maintenance Programme Warning, Not a Weather Event.
OxMaint separates normal wet-bulb-driven variation from genuine tower degradation, and turns the difference into a work order automatically.
How OxMaint Turns Approach Temperature Into a Working KPI
01
Log Cold Water and Wet Bulb Together
Technicians record cold water outlet temperature and ambient wet bulb temperature side by side, from a mobile checklist or a connected sensor, at every rounds inspection or shift log — never as two separate, unlinked readings.
02
Calculate Approach Automatically
OxMaint subtracts wet bulb from cold water outlet the moment both values are entered, plots the result against the tower's design approach, and removes the manual calculation error that creeps into spreadsheet tracking.
03
Trend the Drift, Not Just the Reading
A single high reading on a humid day is normal. A sustained climb across consecutive readings, independent of wet bulb swings, is the pattern OxMaint's trend engine is built to isolate and flag.
04
Open the Work Order Before Capacity Is Lost
Once drift crosses the configured threshold, OxMaint opens a fill inspection, water treatment review, or nozzle cleaning work order automatically and routes it to the responsible technician with the trend chart attached.
Approach Temperature Benchmarks Across Tower Condition
Three Signals Facility Teams Miss Without a Trended KPI
High Priority
Approach Rising While Range Stays Normal
Supply and return temperatures look fine because the chiller is compensating, but the tower itself is losing heat transfer efficiency underneath a stable-looking surface reading.
High Priority
Approach Climbing Across Multiple Weeks
A single warm, humid day pushes wet bulb up and approach can look tighter than usual. A multi-week climb independent of weather is the pattern that actually predicts fouling.
Elevated
Uneven Approach Between Cells on a Multi-Cell Tower
One cell running a noticeably wider approach than its neighbours usually points to a distribution or nozzle problem isolated to that cell rather than a facility-wide condition.
Elevated
Approach Improving After Water Treatment Change
A falling approach trend following a chemical dosing or filtration change is measurable proof that the treatment programme is working — evidence most facilities never formally capture.
Elevated
Approach Spiking After a Fan or Motor Repair
A short-lived approach spike right after mechanical work often points to airflow imbalance from the repair itself, worth a quick recheck before it is logged as tower fouling.
3–4°F
average approach improvement reported by facilities after using trended alerts to catch fouling within the first two weeks of drift
Weeks
earlier detection of scaling and fill fouling compared to relying on manual, occasional approach calculations
One View
approach, range, and wet bulb trends for every tower and every cell in a single facility dashboard
We used to calculate approach by hand from the morning log once a week, if someone remembered. By the time we noticed a problem, the fill was already fouled and the chiller had been running hot for a month. Now every reading calculates approach automatically and we get an alert the moment a cell starts drifting. We caught scaling on cell two of our main tower eleven days after it started instead of finding out from the utility bill.
Facility Engineering Lead, Regional Data Center Campus · OxMaint user
Frequently Asked Questions — Cooling Tower Approach Temperature Software
What is a good approach temperature for a cooling tower?
A well-maintained industrial or HVAC tower typically runs a 5°F to 7°F approach under design conditions, with high-performance towers reaching 2°F to 4°F. Anything drifting more than five degrees above your tower's original design approach generally points to fouling.
Sign in to OxMaint to see your tower's current trend against its design value.
How is approach temperature different from cooling tower range?
Range is the temperature drop across the tower and reflects heat load. Approach is the cold water outlet temperature minus the wet bulb temperature and reflects how efficiently the tower transfers heat to the air, independent of load.
Can rising approach temperature really predict scaling before it is visible?
Yes. Scale and biological fouling reduce fill surface area gradually, and that reduction shows up as a slow, sustained climb in approach readings weeks before it is visible on an inspection or noticeable in chiller performance.
Does OxMaint calculate approach temperature automatically from logged readings?
Yes. Once a technician or a connected sensor logs cold water outlet and wet bulb temperature, OxMaint calculates approach instantly, trends it against the design value, and opens a work order if the drift crosses a configured threshold.
How much energy can a facility save by keeping approach close to design?
Chiller compressor energy typically improves by roughly two to three percent for every degree the condenser water approach is reduced, so closing a five-degree fouling-driven drift can meaningfully lower monthly cooling energy cost.
Book a demo to see the savings calculation for your own tower data.
Your Cooling Tower Is Already Telling You About the Fouling. Most Facilities Just Aren't Logging the Number That Says So.
Automatic approach calculation. Design-value trending. Fouling and scaling alerts. Chiller efficiency protection. OxMaint turns approach temperature from a forgotten log entry into the KPI that catches the problem while it is still cheap to fix.